Johnson & Johnson (JNJ) is an American multinational corporation founded in 1886 that develops medical devices, pharmaceuticals, and consumer packaged goods. Its common stock is a component of the Dow Jones Industrial Average, and the company is ranked No. 36 on the 2021 Fortune 500 list of the largest United States corporations by total revenue.
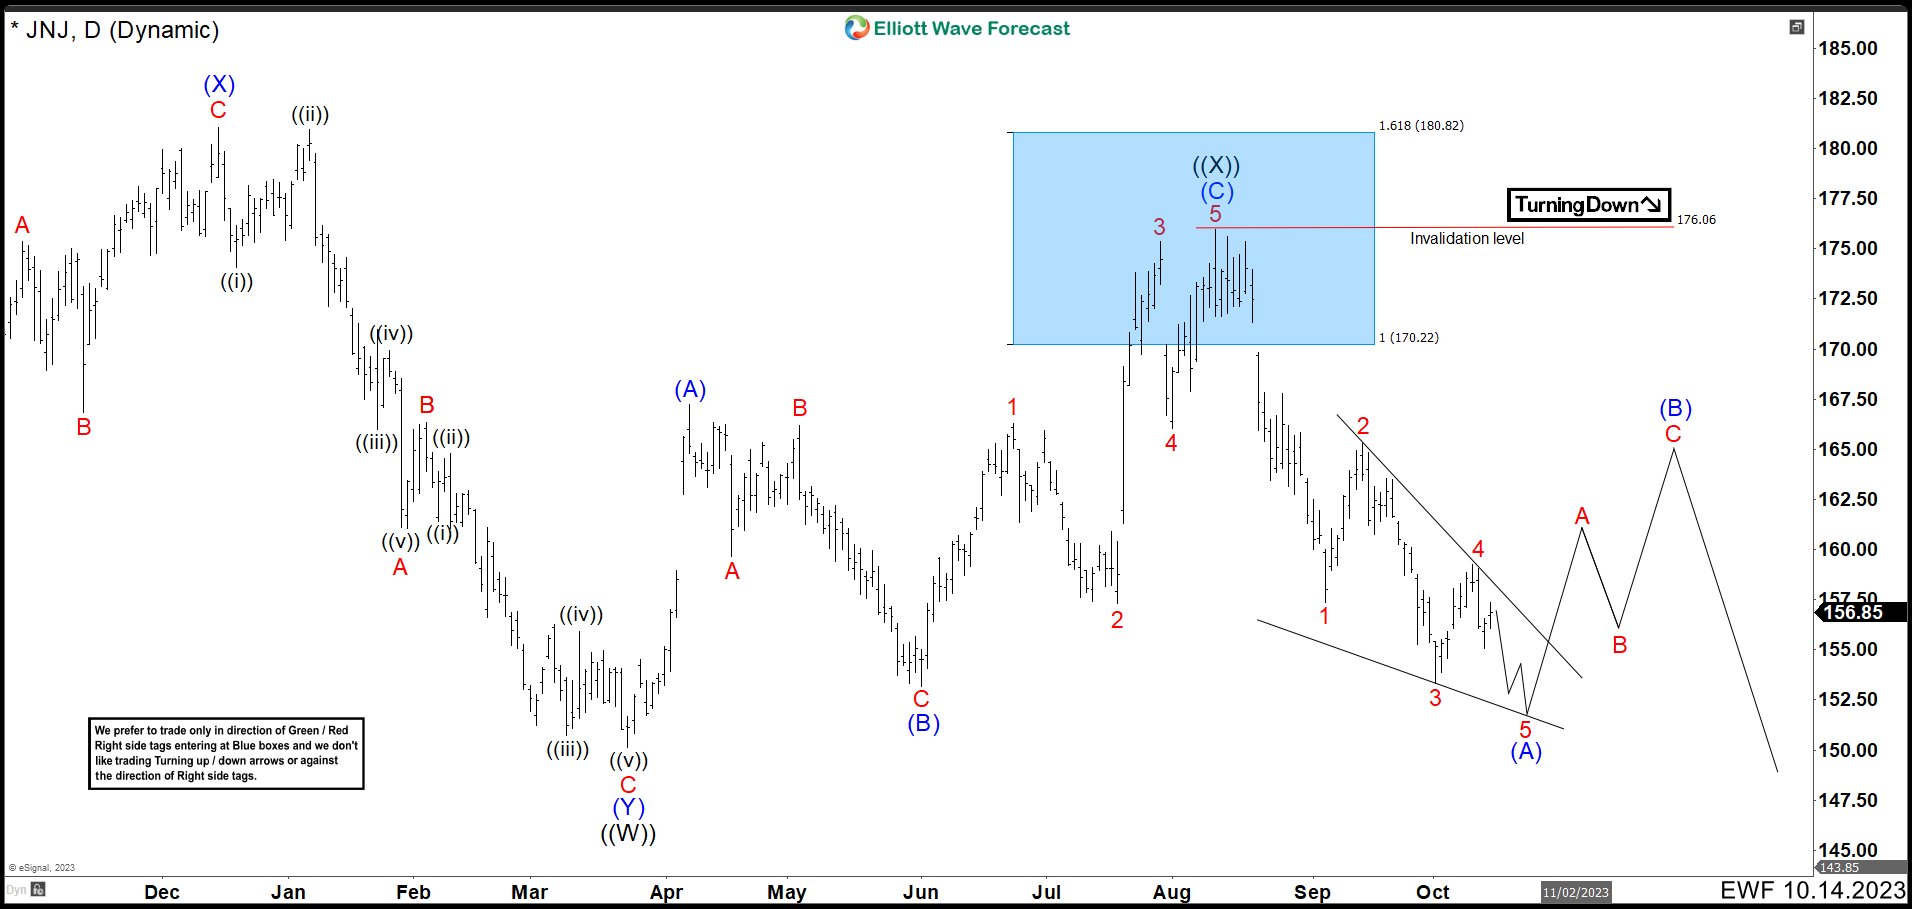
JNJ Daily Chart October 2023
In the last analysis, we called 3 waves more to the downside to end a double correction structure ((W)), ((X)), ((Y)). The stock reacted lower from a blue box area ending wave ((X)) and starting wave ((Y)). Then we expected to finish a wave (A) as a leading diagonal, bounce in wave (B) and continuing lower in (C). As price actions stays below 175.97 high, we are looking to keep lower prices.
JNJ Daily Chart February 2024
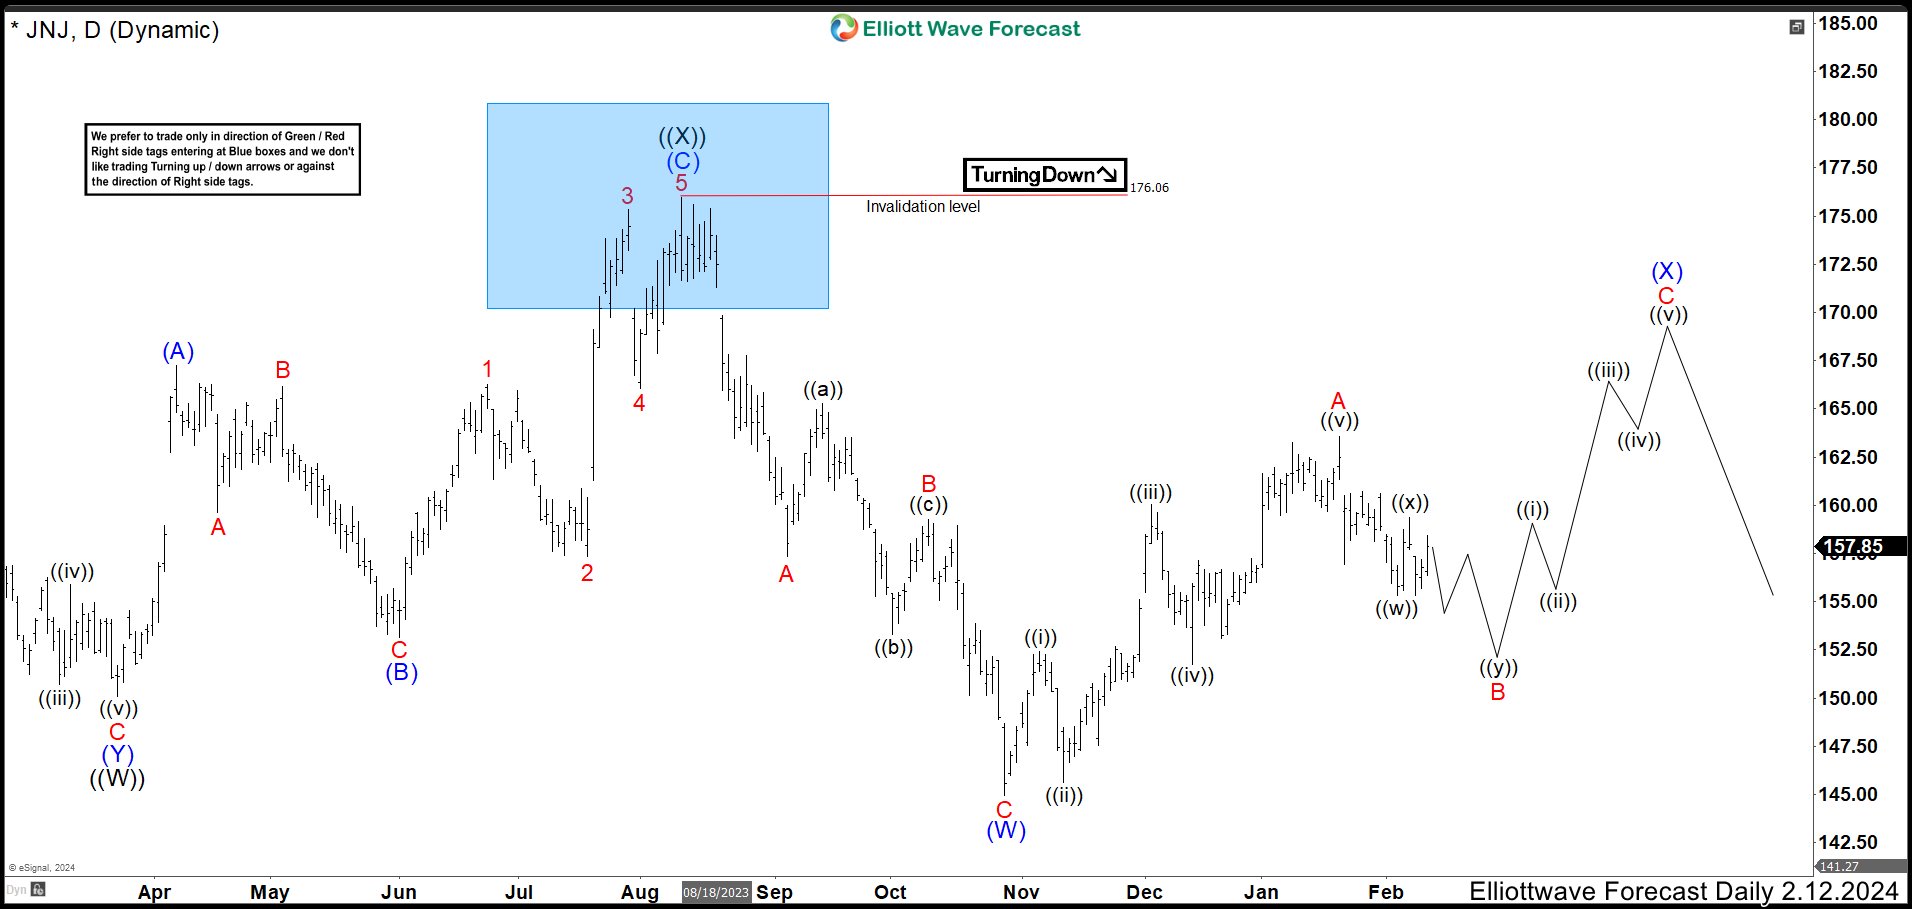
Down from 175.97 high, JNJ ended wave A at 157.35 low and wave B made a running flat correction completing at 159.27 high. Then, market continued lower to end the first 3 swings of a double correction at 144.95 low as wave C of (W) and wave (W). The stock rallied since late October 2023 starting connector (X) pullback. It built a leading diagonal structure finishing wave A at 163.58 high and actually JNJ is developing wave B correction. This wave B could complete in 152 – 149 area and the market should break higher in wave C to end wave (X) before resuming to the downside again.
Source: https://elliottwave-forecast.com/stock-market/johnson-jnj-bearish-sequence-bull-trap/