
Bitcoin (BTCUSD) has been rallying strongly since September 2023 low. It rallied from a low of $24920 to a high of $49048 gaining $24128 which is almost a 100% gain in 4 months. It made a sharp pullback last week and today we will look at the Elliott wave structure of Bitcoin since November 2022 low and what the next move in Bitcoin should be.
Bitcoin Long-Term Elliott Wave Analysis
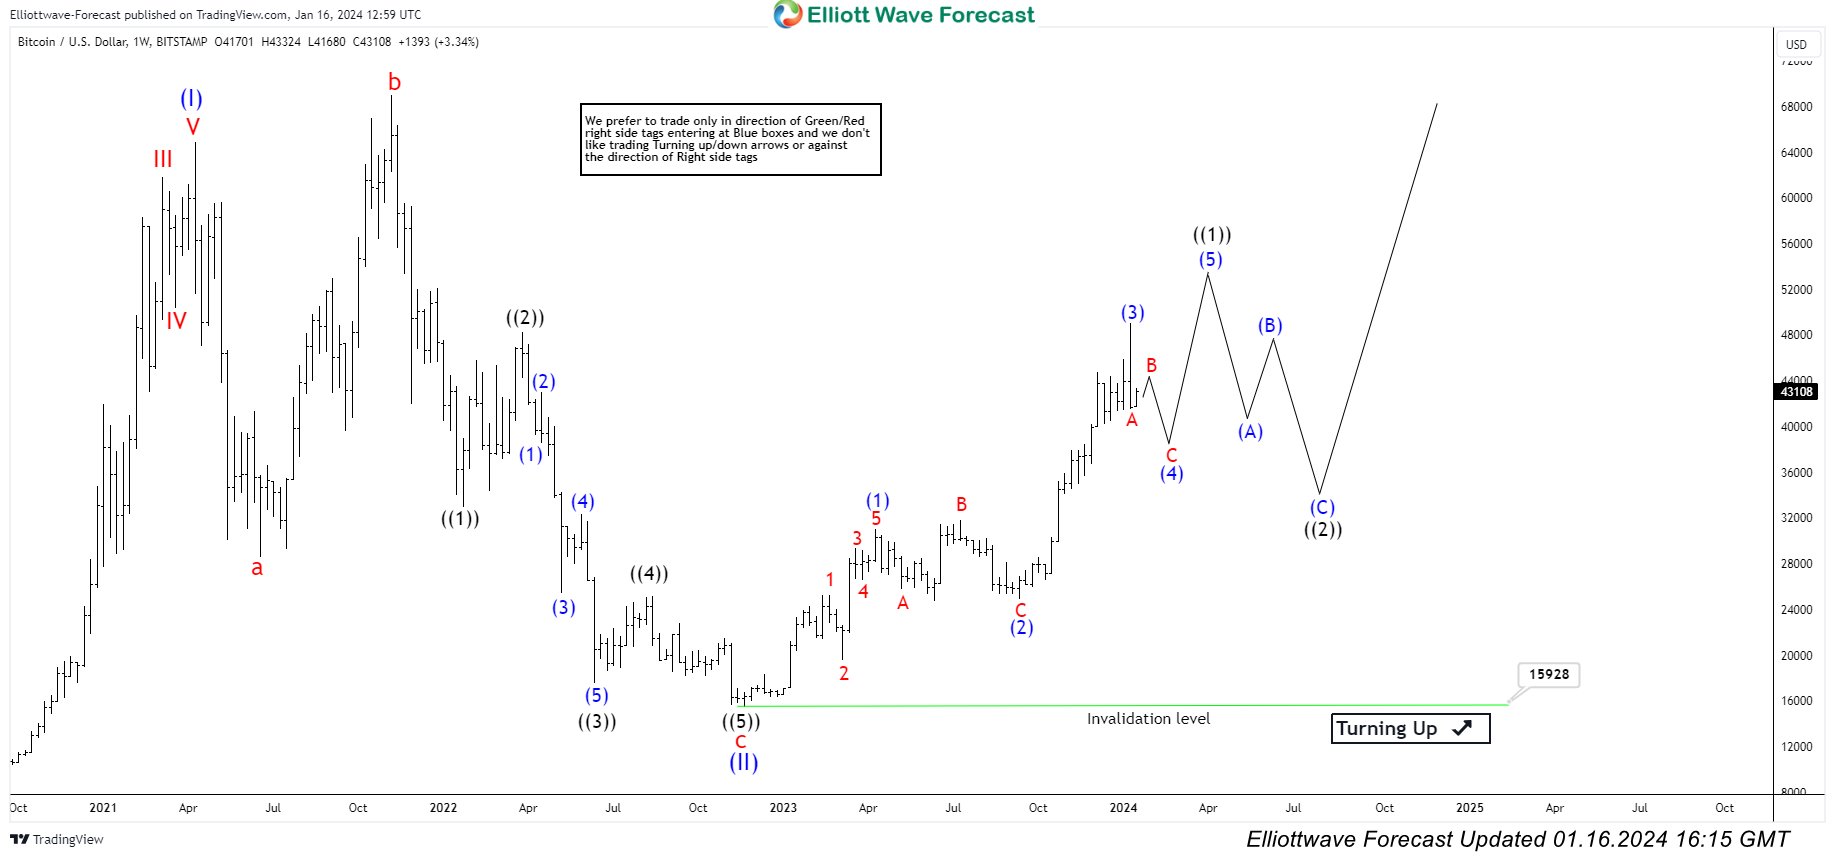
The bitcoin chart below shows a rally from November 2022 low is so far in 3 waves but we have USDPLN calling more downside in USD Index which means Bitcoin should also be extending higher after a pullback and there we are treating the current pull back as a wave (4) pull back and expecting 1 more leg higher to complete the cycle from November 2022 low as an impulse wave. A new high must show momentum divergence for it to quality as a wave (5). If momentum divergence gets erased, then it should be nesting and open up more extension to complete wave (3). Once the cycle from the November 2022 low completes, we can see a larger pullback in 3 or 7 swings to correct the cycle from November 2022 low before the rally resumes. We don’t like selling and expect buyers to appear in the dips in 3, 7, or 11 swings.
Bitcoin Long-Term Elliott Wave Analysis – 2nd View
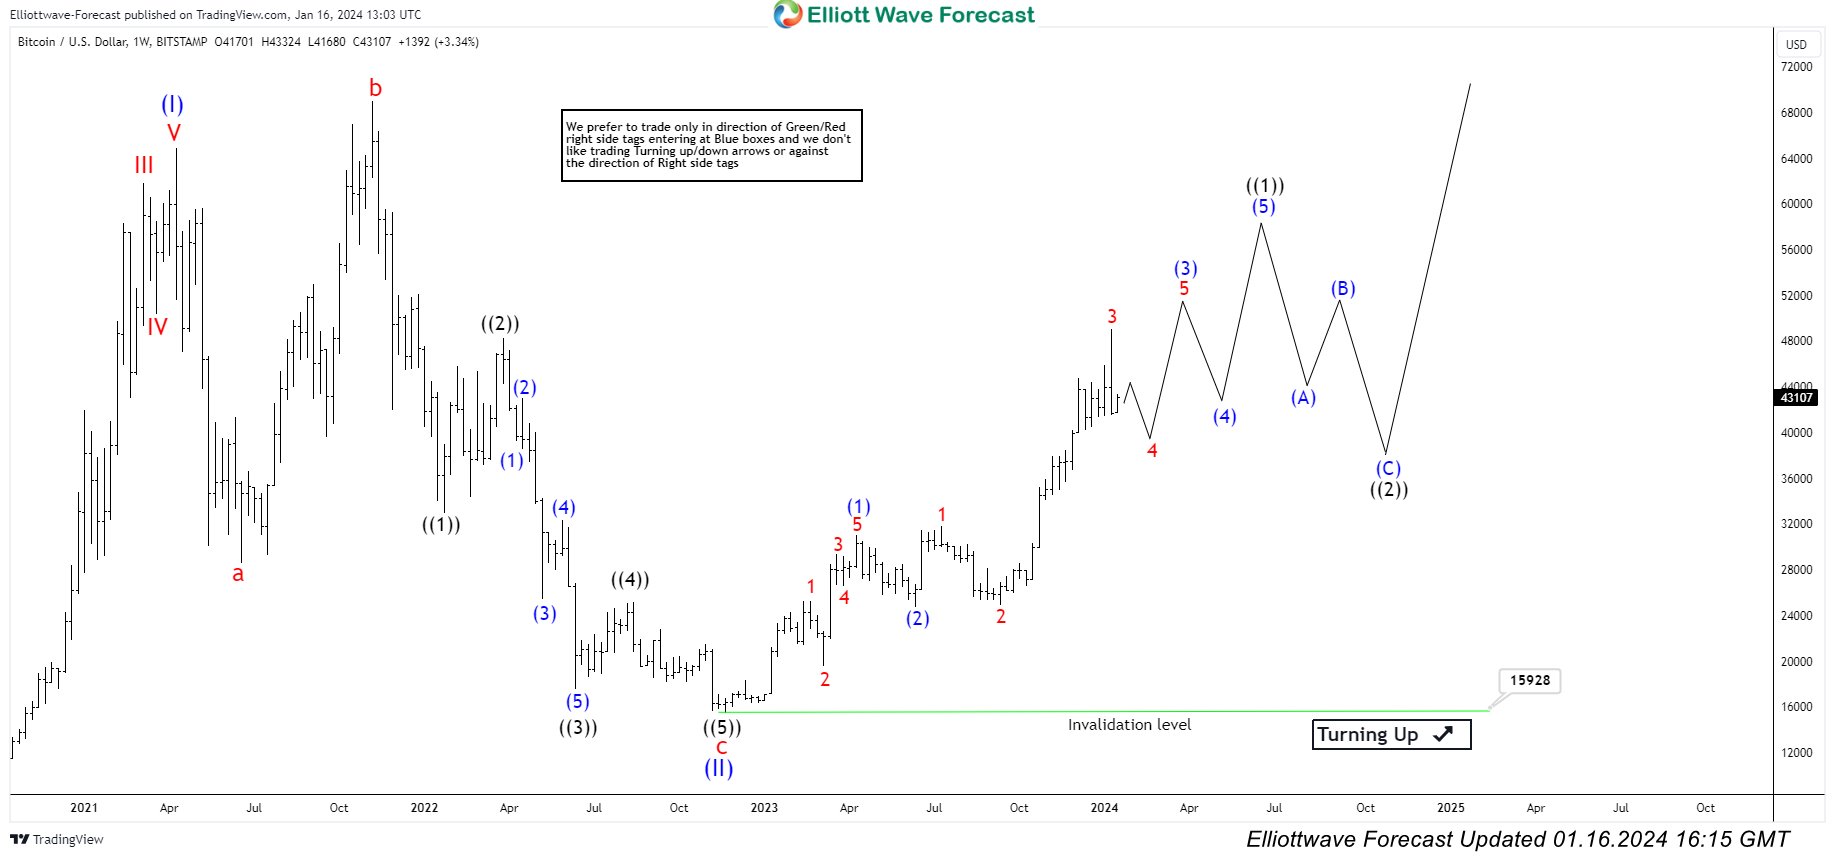
The Bitcoin chart below is a slight variation of the one above and shows cryptocurrency to be still within wave (3) and treats current pull back to be wave 4 within wave (3). In either case, we don’t like selling and the right side remains up so we expect buyers to appear in the dips in 3, 7 or 11 swings for extension higher to complete the cycle from November 2022 low.
Bitcoin 4-Hour Elliott Wave View – Path 1
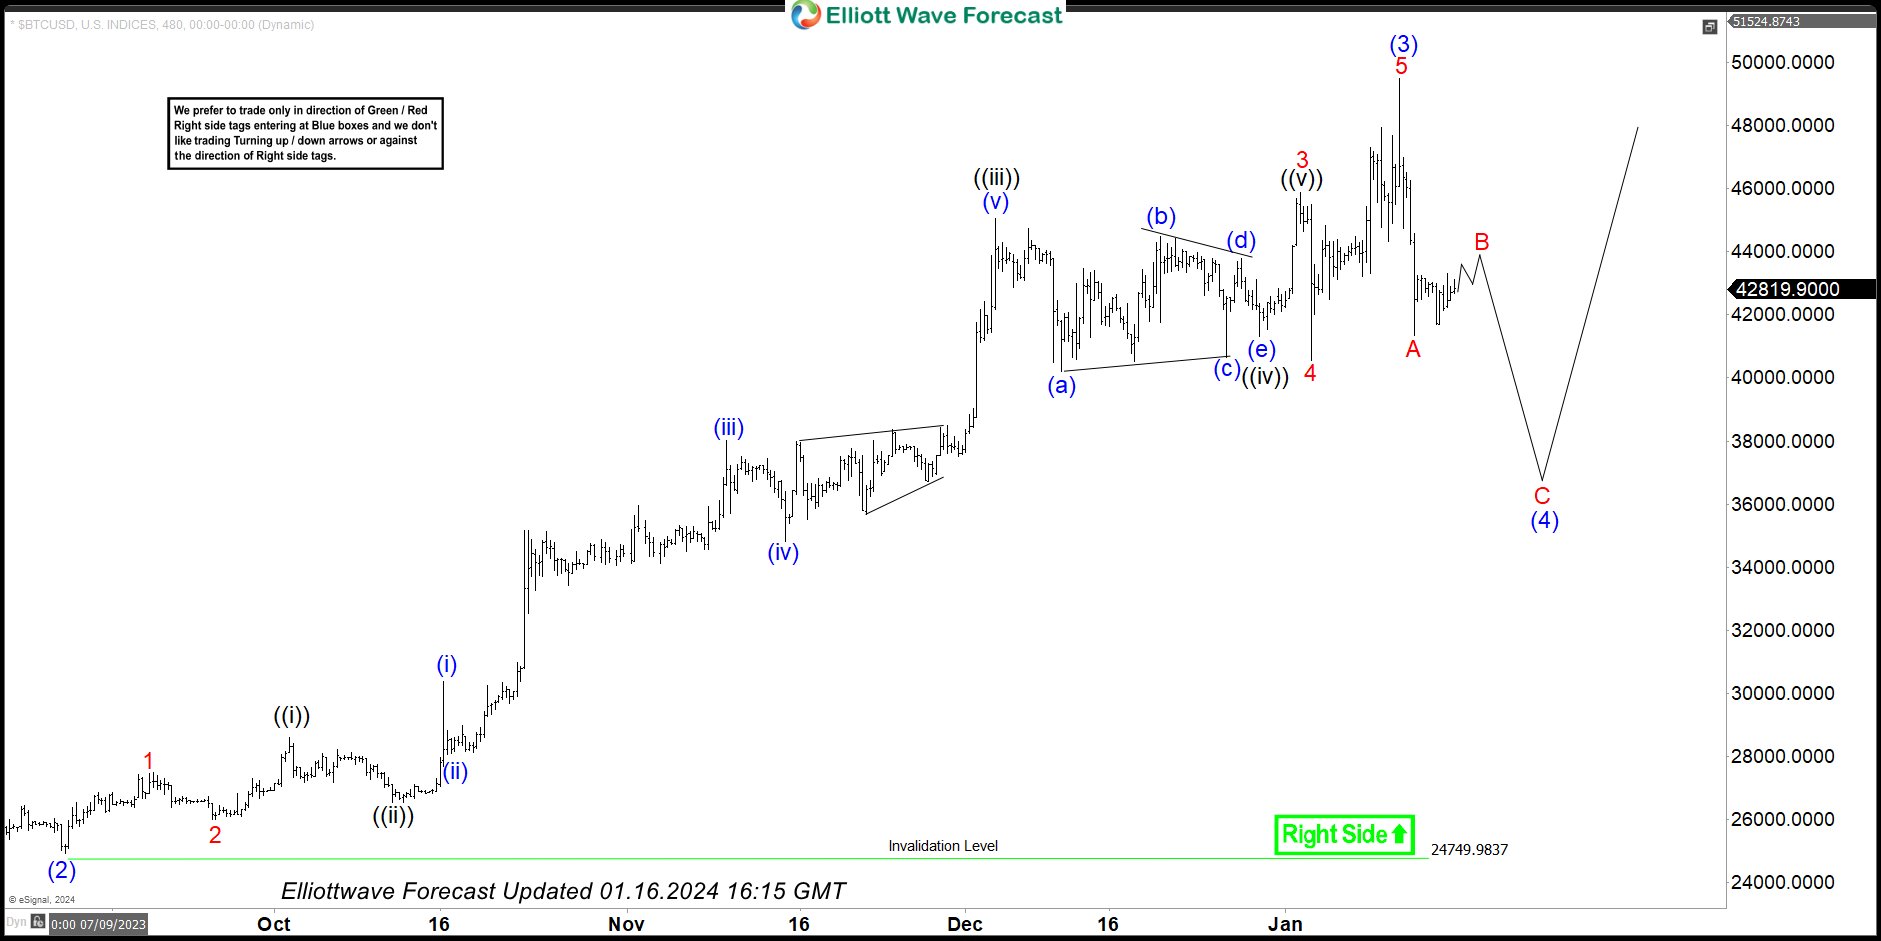
BTCUSD chart below shows the proposed structure of wave (4) pullback to be a Zigzag Elliott Wave Structure and still expects C leg lower to complete the pullback. We don’t like selling and once wave B is complete, we expect buyers to appear at 100 – 161.8 Fibonacci extension area of A-B cycles. From there, it can resume the rally in proposed wave (5) or bounce in 3 waves at least.
Bitcoin 4 Hour Elliott Wave View – Part 2
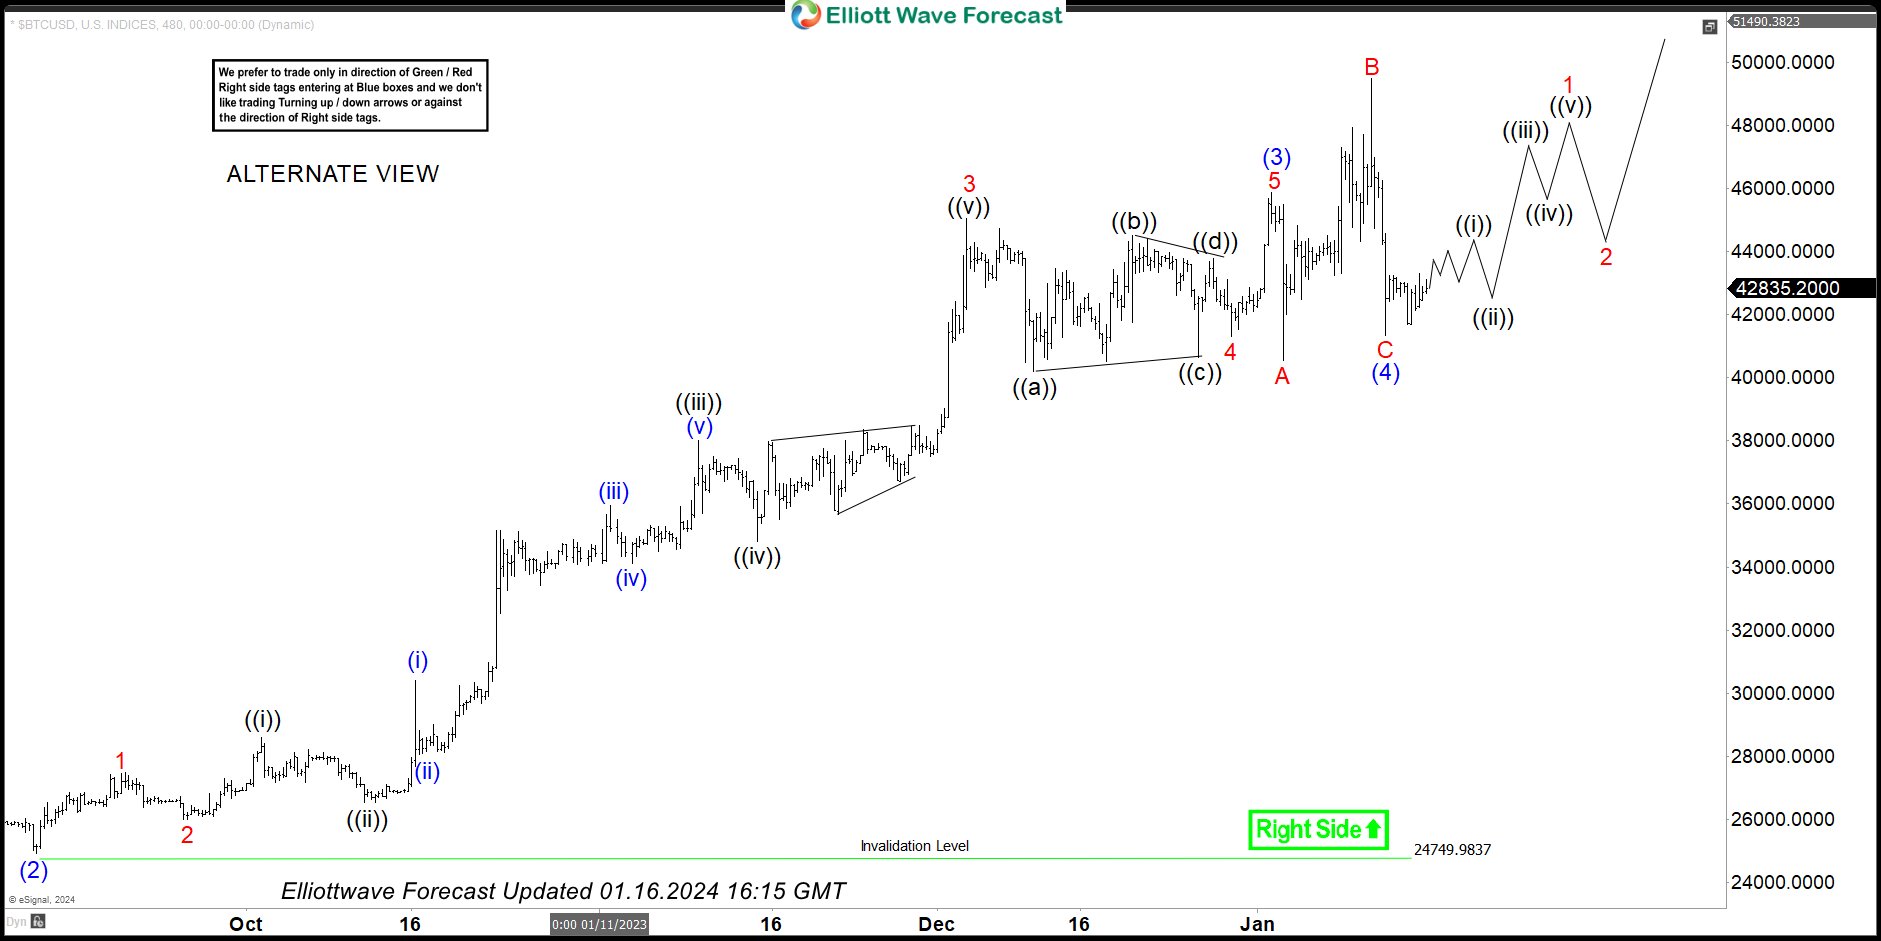
BTCUSD chart below shows an alternate possibility of a FLAT in wave (4) which has been completed at 41339 (1.12.2024) low and it will now resume the rally in wave (5). A break above 49500 (1.11.2024) high is needed to confirm this view. Another way would be if BTCUSD is holding above the 41339 low and the USD Index reaches an extreme area up from the 12.28.2023 low. In either case, the right side remains bullish and we don’t recommend selling.
Source: https://elliottwave-forecast.com/video-blog/bitcoin-elliott-wave-suggests-buyers-in-control/