Sony Group Corporation, commonly known as SONY, is a Japanese multinational conglomerate corporation. As a major technology company, it operates as one of the world’s largest manufacturers of consumer and professional electronic products, the largest video game console company.
SONY ended an impulse that began at the end of 2012. The share price reached 133.75 in January 2021, that was, 9 years of upward movement. We called this impulse as wave (I). The price started to fall forming a double correction and after almost 5 months wave (II) ended.
SONY Weekly Chart May 12th 2023
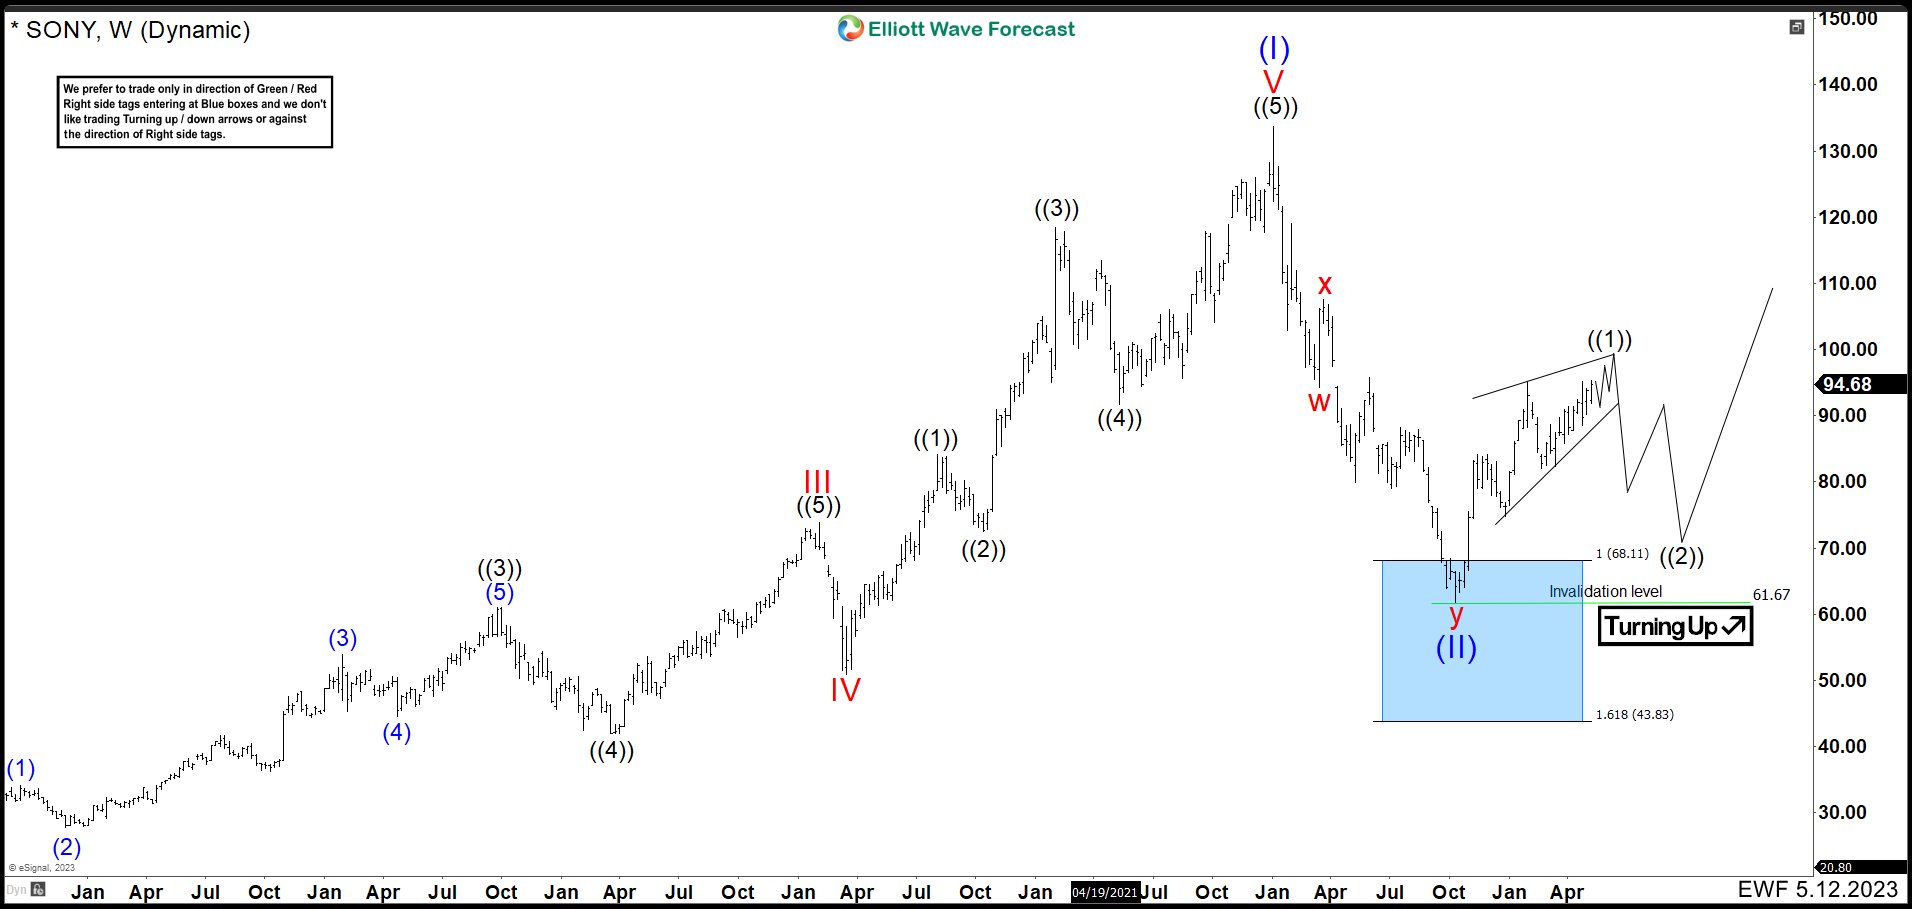
You can see above the weekly chart of May. This was what we are expected in the stock: “The market has kept the upward movement. From the low of 61.67, we can count 5 swings up giving the idea of a leading diagonal structure. We currently need to break above the 95.23 high in order to have the minimum number of swings to complete the diagonal. However, SONY share prices could go as high as around 98.41 to finish the wave ((1)). Once we see a strong drop in the price we could give for ended the wave ((1)). From there, the market would enter a corrective phase where we should see 3, 7 or 11 swings down to complete wave ((2)) before continuing the rally.
SONY Weekly Chart Oct 1rt 2023 (Scenario 1)
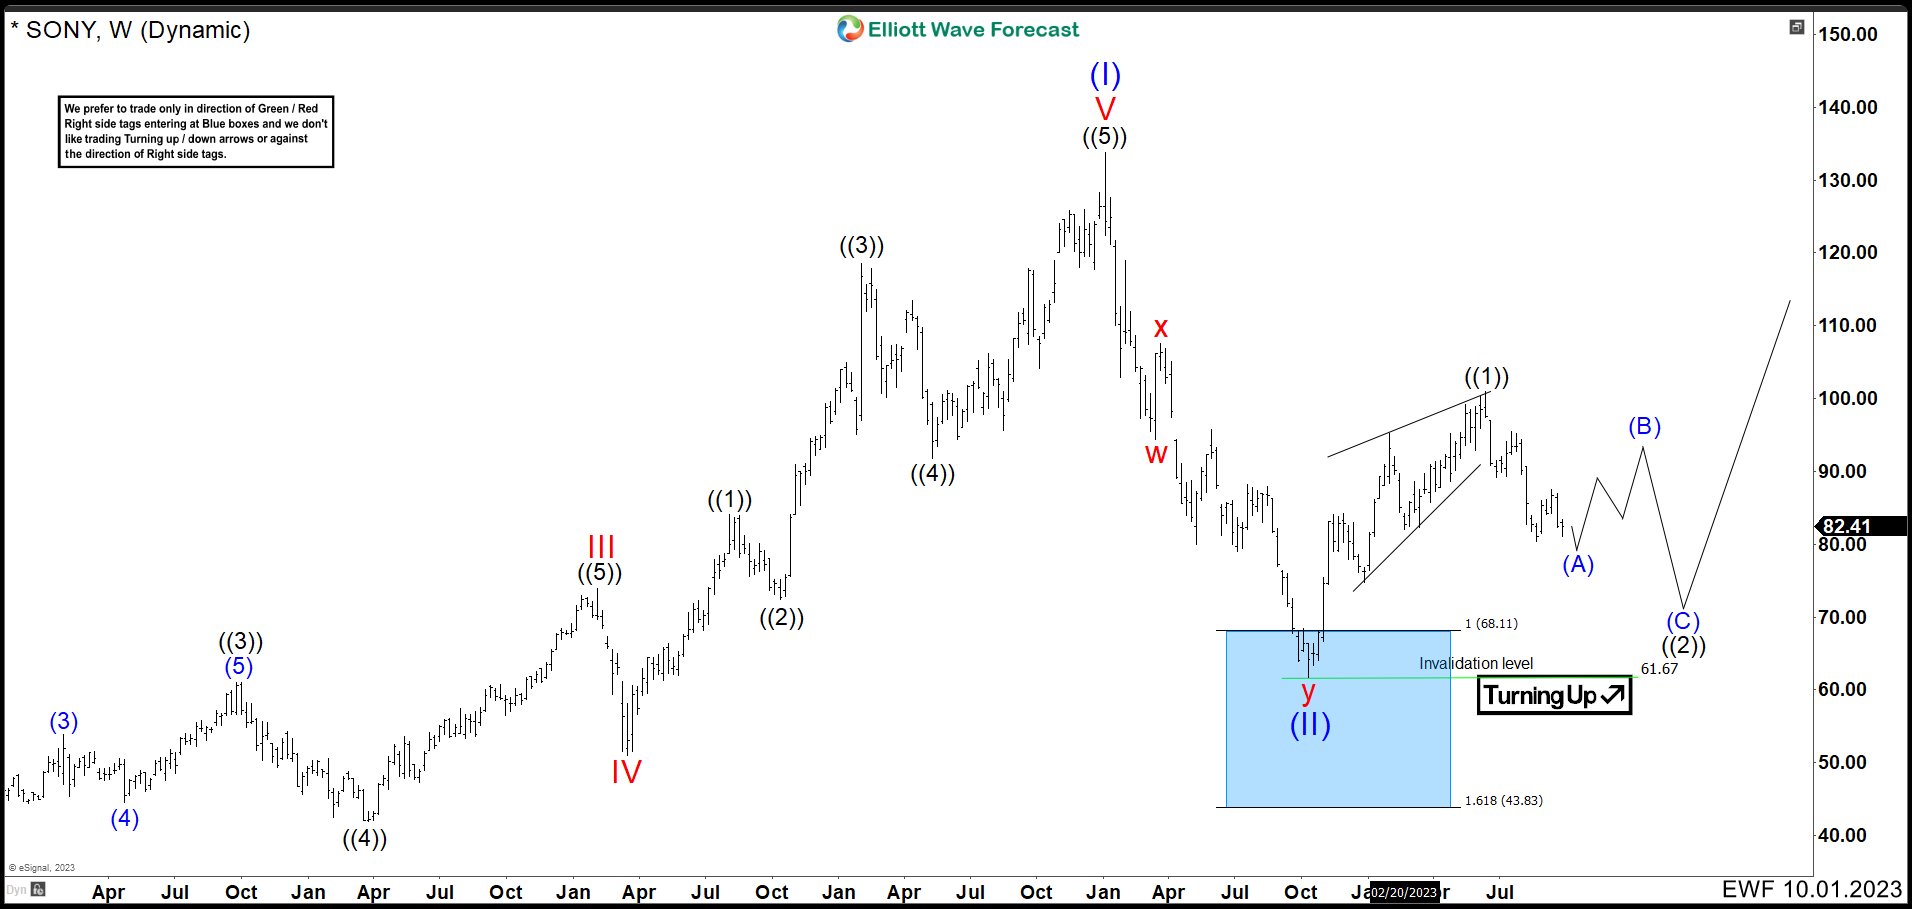
Currently, the stock ended the leading diagonal as expected. Up from wave (II) low, wave (1) ended at $84.19, then pullback as wave (2) finished at $74.81. SONY continued the rally ending wave (3) at $95.23 high followed by a reaction lower entering in the wave (1) area. Wave (iv) ended at $84.02 and last push higher as wave (v) completed a leading diagonal. Wave ((1)) finished at $100.94 high. In the third week of June, we saw a strong movement to the downside, give us the idea that wave ((1)) was ended and the correction as wave ((2)) started.
We are looking for 3 swings at least to end wave ((2)) correction. 3 swings down are already ended, but it is still possible to make 5 swings lower breaking $80.34 low to complete wave (A) as an impulse. If this happens, wave ((2)) is not completed. We should see a corrective bounce to build wave (B) and another 5 swings lower as wave (C) to finish wave ((2)). Once this structure is complete ended the stock should rally again.
SONY Weekly Chart Oct 1rt 2023 (Scenario 2)
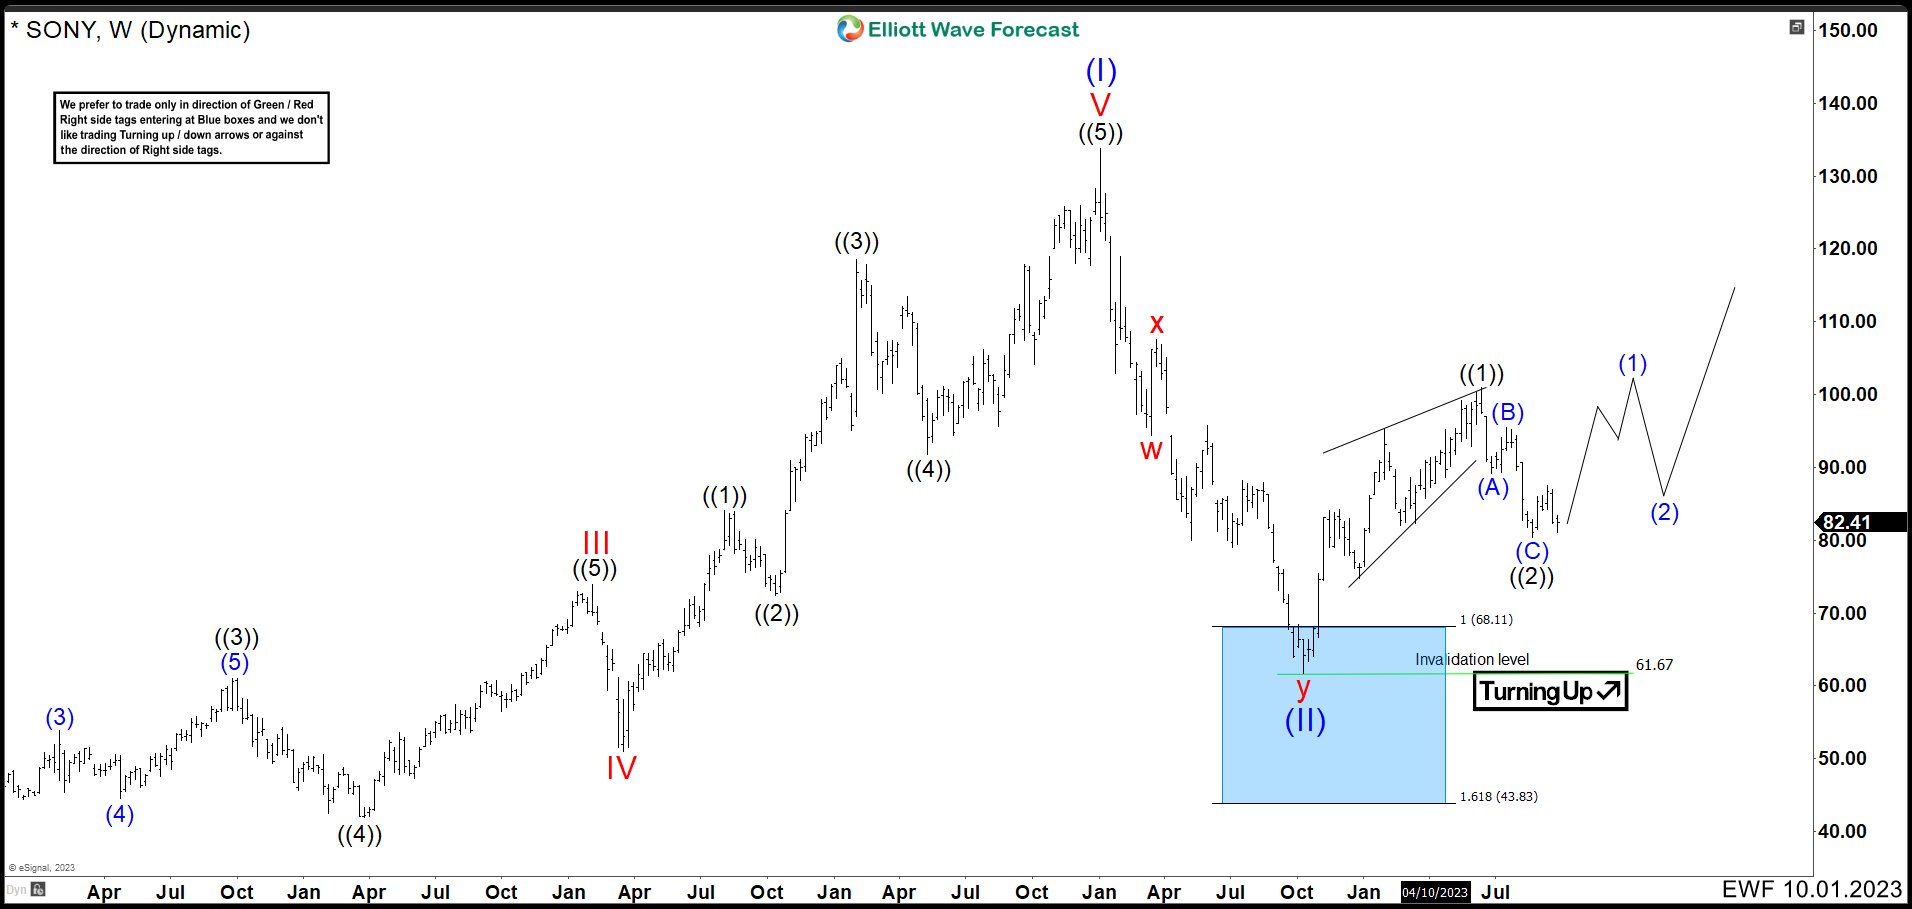
In the chart above we can see scenario 2. It indicates that wave ((2)) has already ended and another new rally would begin. To confirm that wave ((2)) is over, we need this new rally to break above $100.94 high and price action to hold above $80.34 low.
Source: https://elliottwave-forecast.com/stock-market/sony-give-new-buying-opportunities/