
Novavax, Inc. is an US American biotechnology company. Founded in 1987 and headquartered in Gaithersburg, Maryland, USA, it is a part of Russel1000 index. Investors can trade it under the ticker $NVAX at NASDAQ as well as $NVV1 at XETRA. Before 2020, the company has developed vaccines to counter such diseases like Ebola, influenza, respiratory syncytial virus (RSV) and others. During 2020, Novavax has redirected the efforts on development and approval of Nuvaxovid vaccine for COVID-19.
Even though the Novavax’ engagement in the vaccine development is of high public attention, the stock price was in a steady decline from the highs of February 2021. In article from April 2022, we saw the stock price entering the weekly buying area. In this article, we explain that the next bullish cycle might have already started. We talk about $NVAX wave structure and about short- to long-term price target areas.
Novavax Monthly Elliott Wave Analysis 07.10.2023
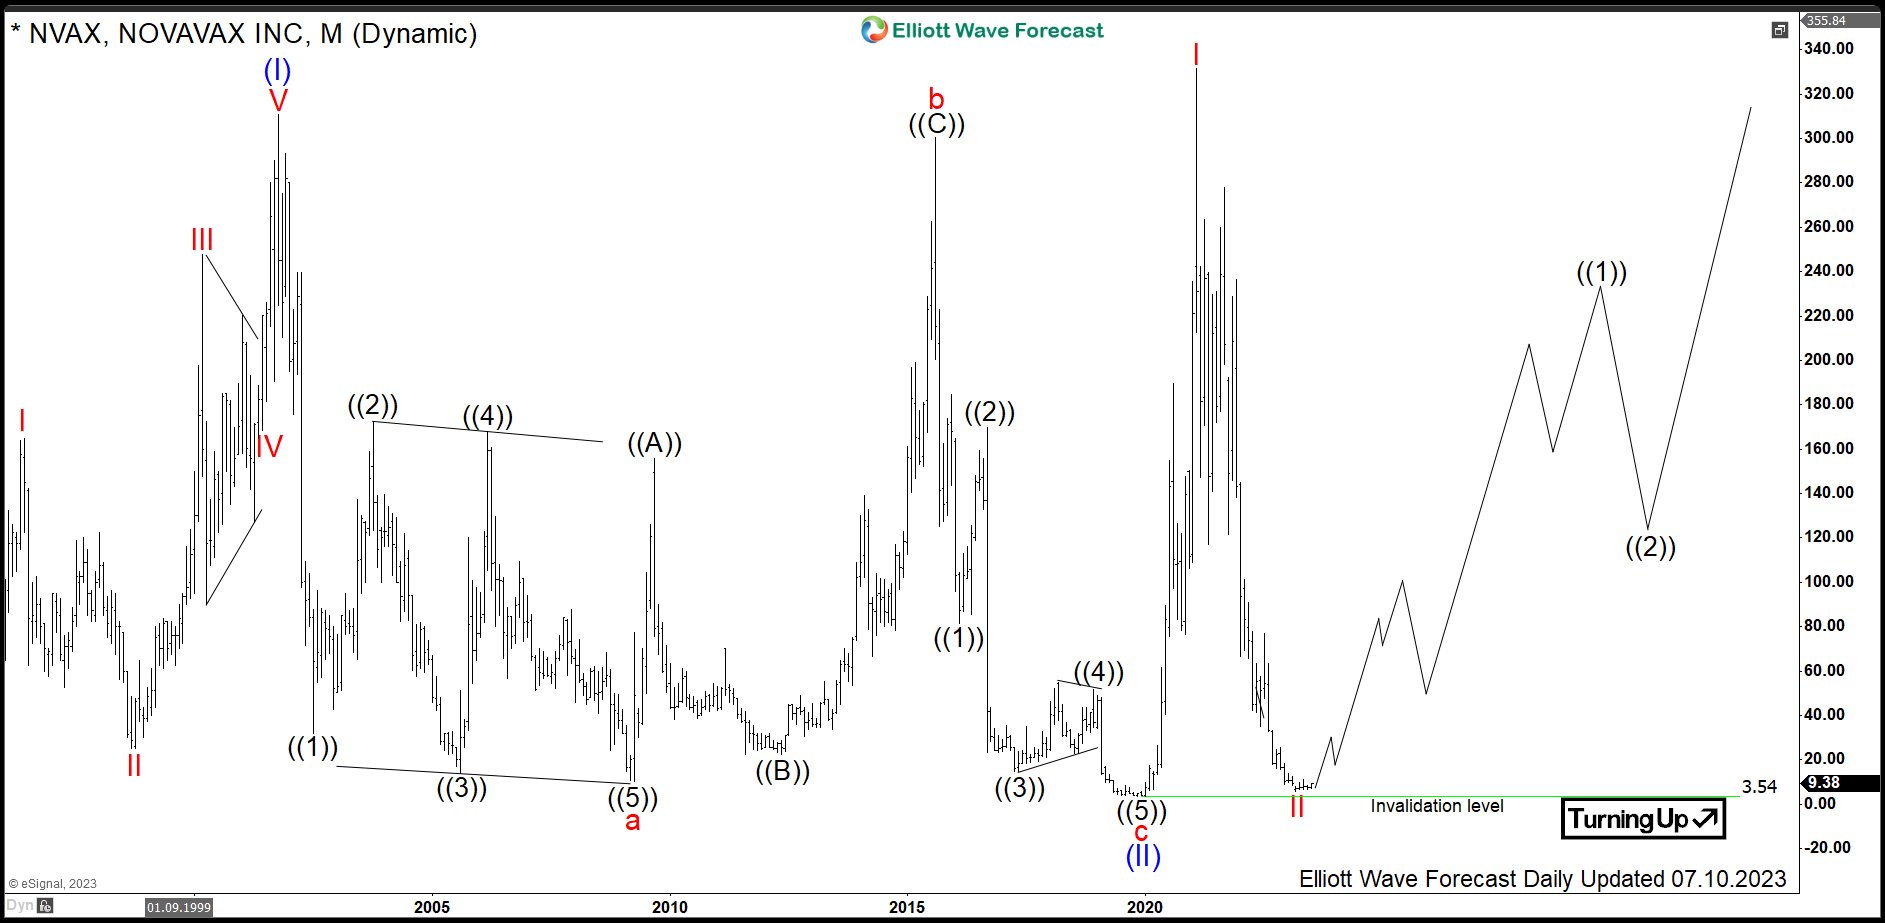
The monthly chart below shows the Novavax stock $NVAX traded at Nasdaq. From the all-time lows, the stock price is showing a nesting price action. First, one can see an Elliott wave motive wave pattern within blue wave (I) of super cycle degree. It has ended on October 2001 at 311 highs. From there, a pullback in wave (II) has provided a slow consolidation ended in November 2019 at 3.54 lows. During 18 years, the stock price has lost 99% of the value.
From the lows of November 2019, a new cycle in blue wave (III) has started. The target for blue wave (III) will be 315-506 area and even beyond.
Novavax Weekly Elliott Wave Analysis 07.10.2023
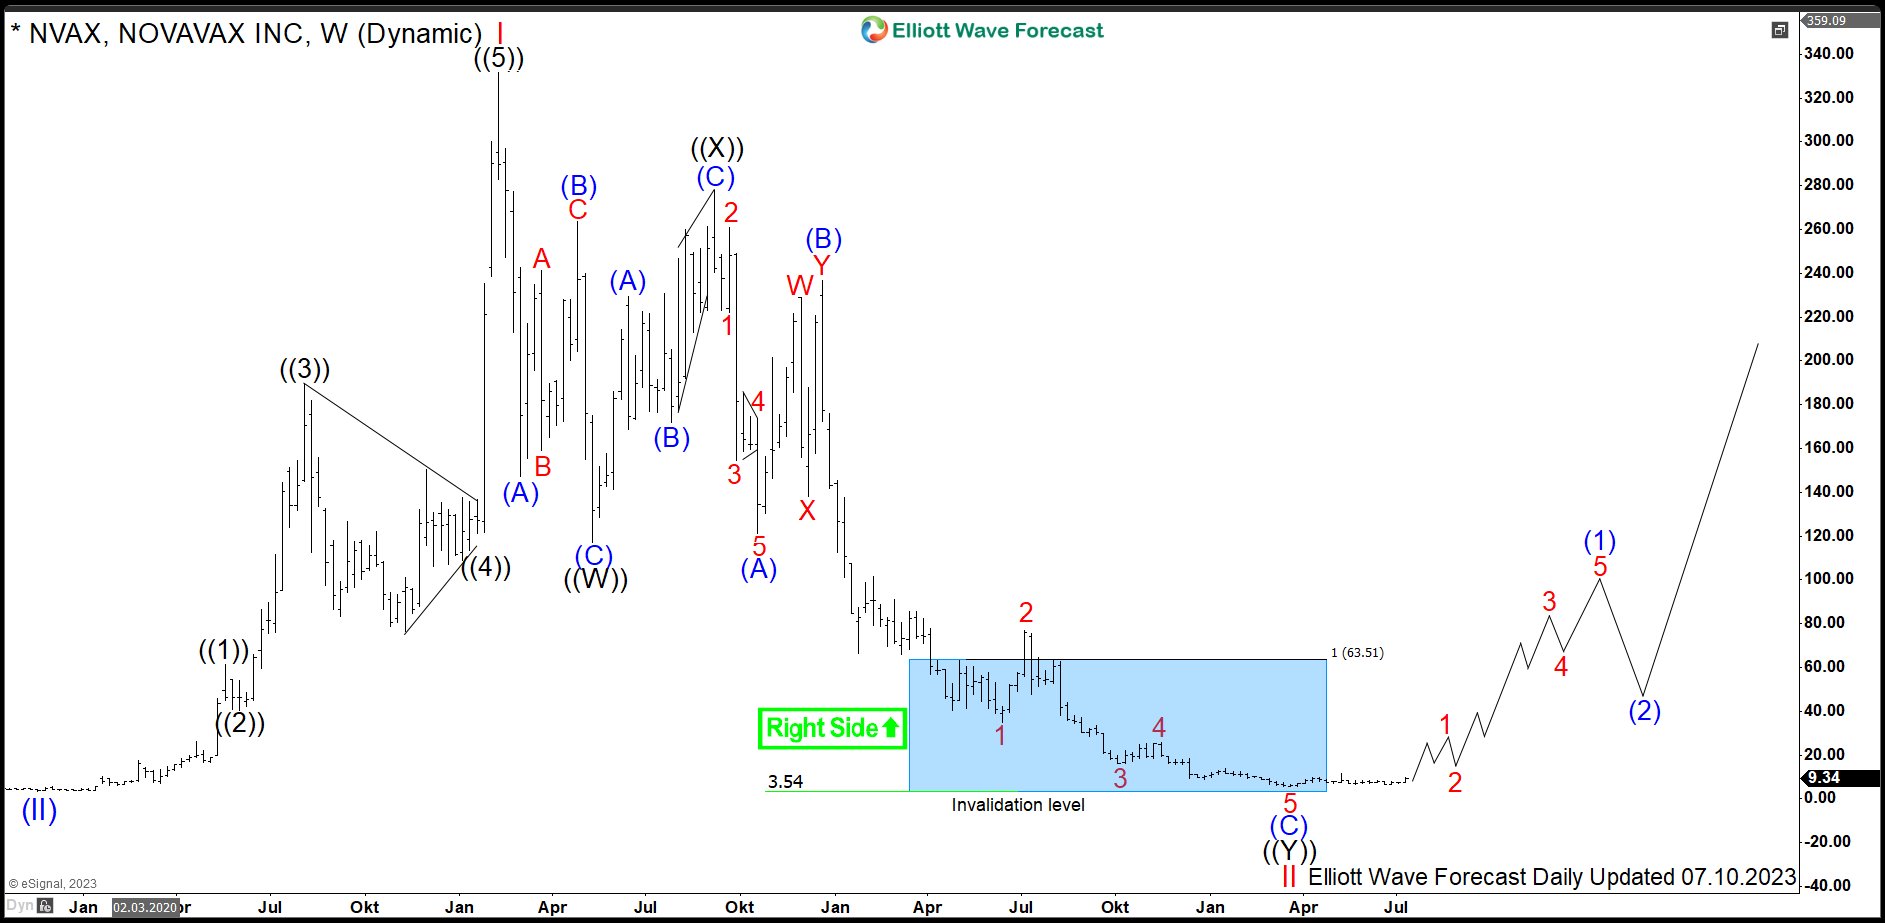
The weekly chart below shows first stages of the blue wave (III). Hereby, we can see a nest comprising of red waves I and II. The initial impulsive advance have been discussed in the article from April 2020. Importantly, the $NVAX price has broken towards the new all-time highs. As a matter of fact, it has confirmed next extension higher. Hereby, red wave I has printed its top at 331.68 on February 2021. From there, pullback in red wave II has unfolded as double three structure.
Firsty, 3 swings in black wave ((W)) of red wave II have printed a low at $117.12 in May 2021. Then, a bounce has set a connector wave ((X)) at $277.80 highs in September 2021. Later on, the price has broken 117.12 lows opening up a bearish sequence. As a consequence, target area for black wave ((Y)) is towards 63.51-3.54 area. As a matter of fact, 3 waves of black wave ((Y)) have reached already the 63.51-3.54 support area. It is the the preferred view that the correction has ended in March 2023 at $5.61 lows. While above there, a new bullish cycle in red wave III might have started. Investors and traders should stay long from weekly support area. The target for wave III will be 335-538 area and even higher.
Novavax 8 Hours Elliott Wave Analysis 07.10.2023
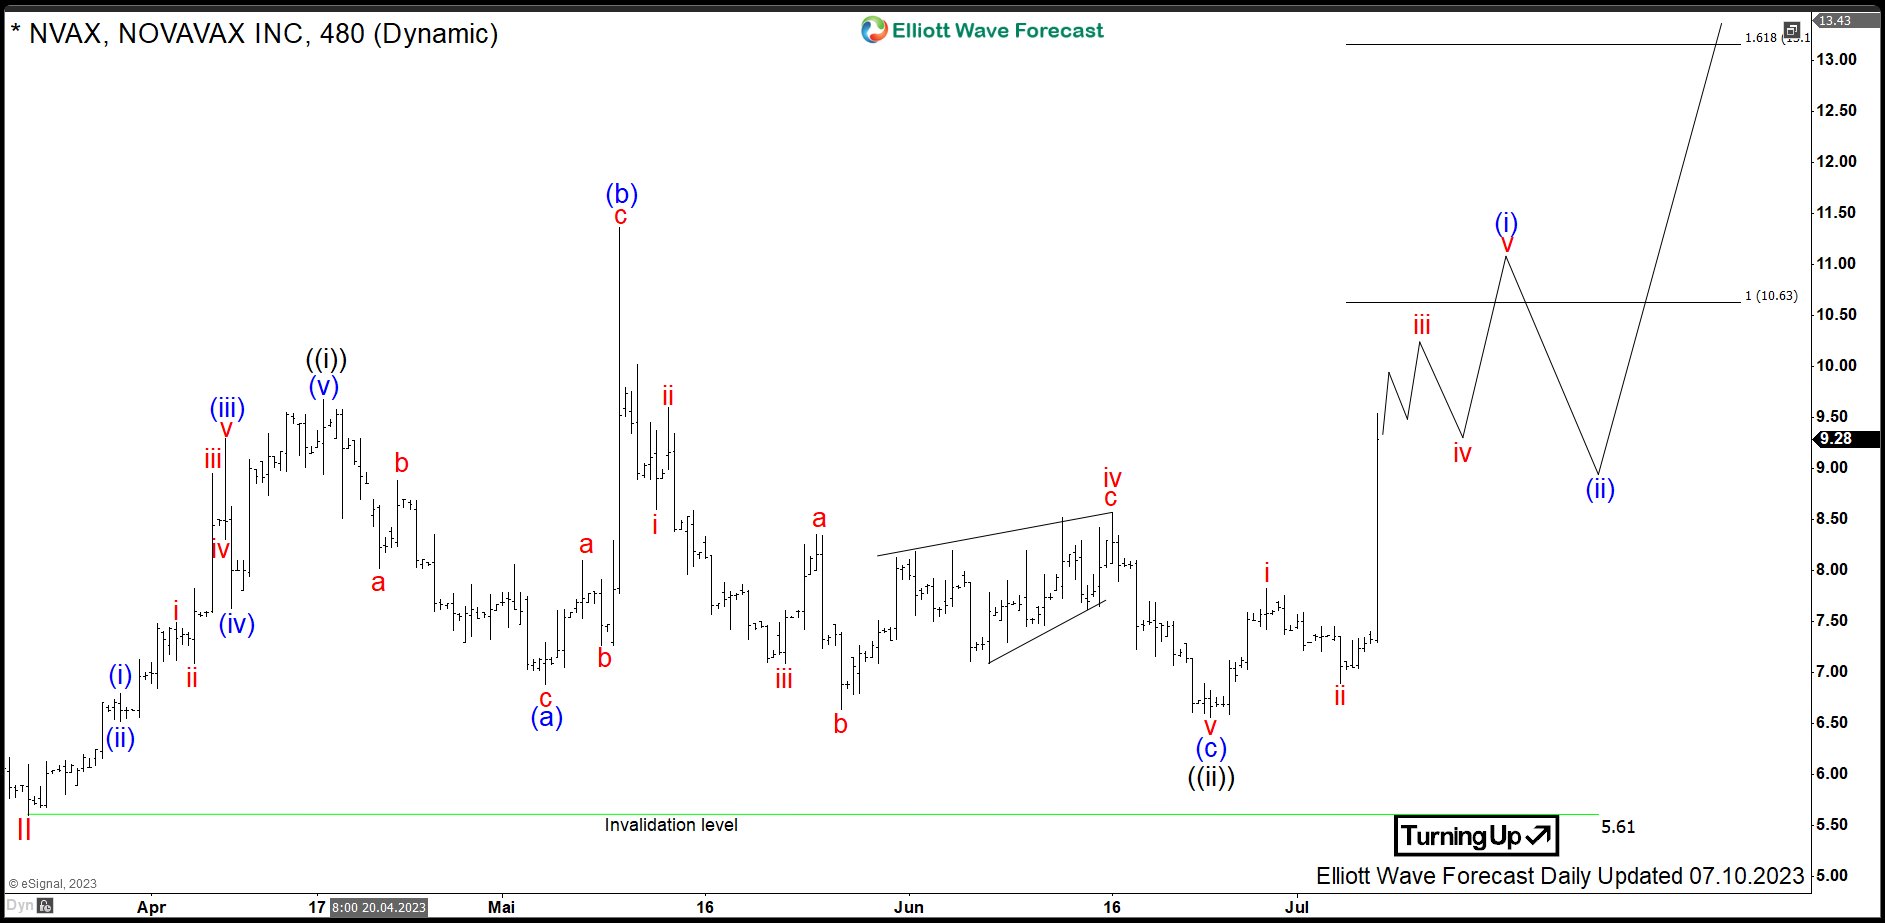
The 8 Hour chart below shows in more detail the initial stages of the red wave III. From the March 2023 lows at $5.61, red wave 1 of blue wave (1) of black wave ((1)) of red wave III is unfolding as an impulse. Within it, first nest comprising black waves ((i))-((ii)) has ended in June 2023. From 6.56 lows, black wave ((iii)) is in progress. It can extend towards 10.63-13.16 area and even beyond. Once finished, pullback in black wave ((iv)) should find support in 3, 7 swing for final push higher in black wave ((v)) to accomplish red wave 1. Then, expect consolidation in red wave 2 before acceleration higher in red wave 3 can happen.
Investors should stay long $NVAX from 63.51-3.54 area weekly support area. Traders can be waiting for red wave 1 to end first and then buy dips in red wave 2 in 3, 7 swings against 5.61 lows.
Source: https://elliottwave-forecast.com/video-blog/novavax-bullish-cycle-weekly-area/