
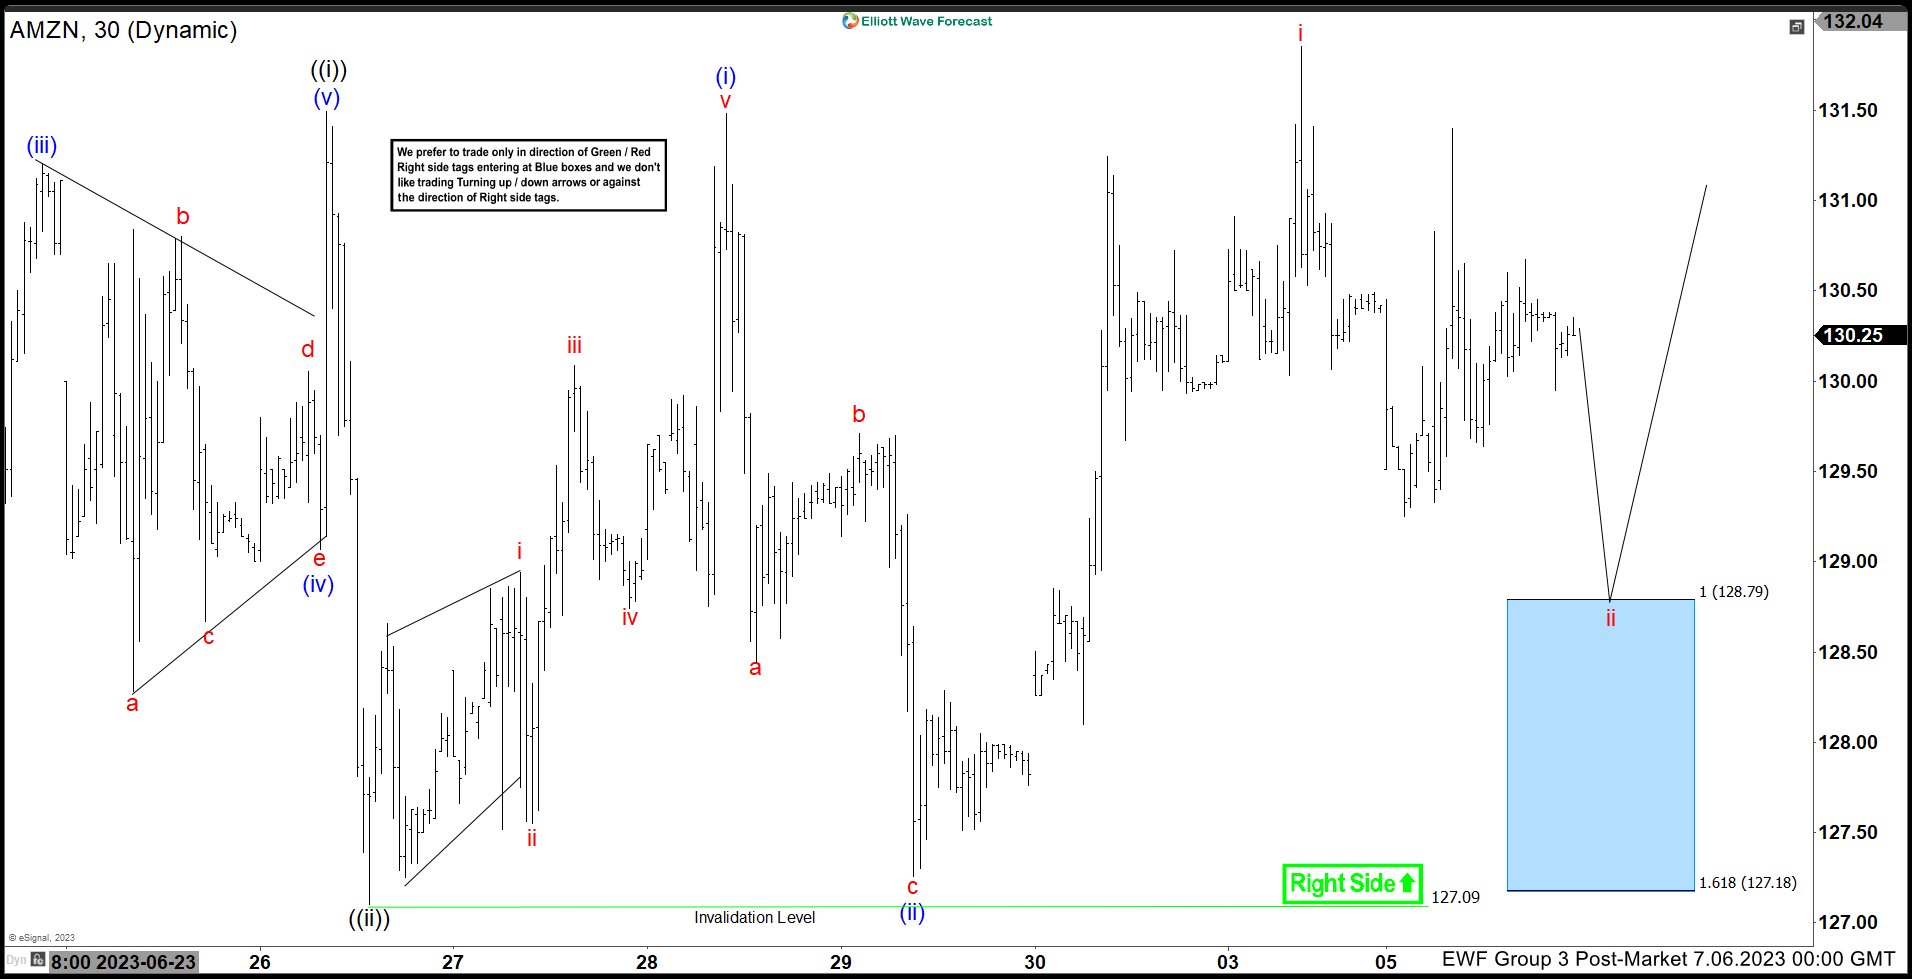
Hello everyone. In today’s article, we will look at the past performance of the 1 Hour Elliott Wave chart of Amazon.com Inc. ($AMZN) The rally from 6.26.2023 low unfolded as a 5 wave impulse with an incomplete bullish sequence from 6.29.2023 low. So, we advised members to buy the pullback in 3 swings at the blue box area ($128.79 – 127.18). We will explain the structure & forecast below:
$AMZN 1H Elliott Wave Chart 7.06.2023:
Here is the 1H Elliott Wave count from 7.06.2023. The rally from 6.29.2023 at blue (ii) unfolded in a 5 wave impulse which signaled a bullish trend. We expected the pullback to find buyers in 3 swings at $128.79 – 127.18 where we entered as buyers.
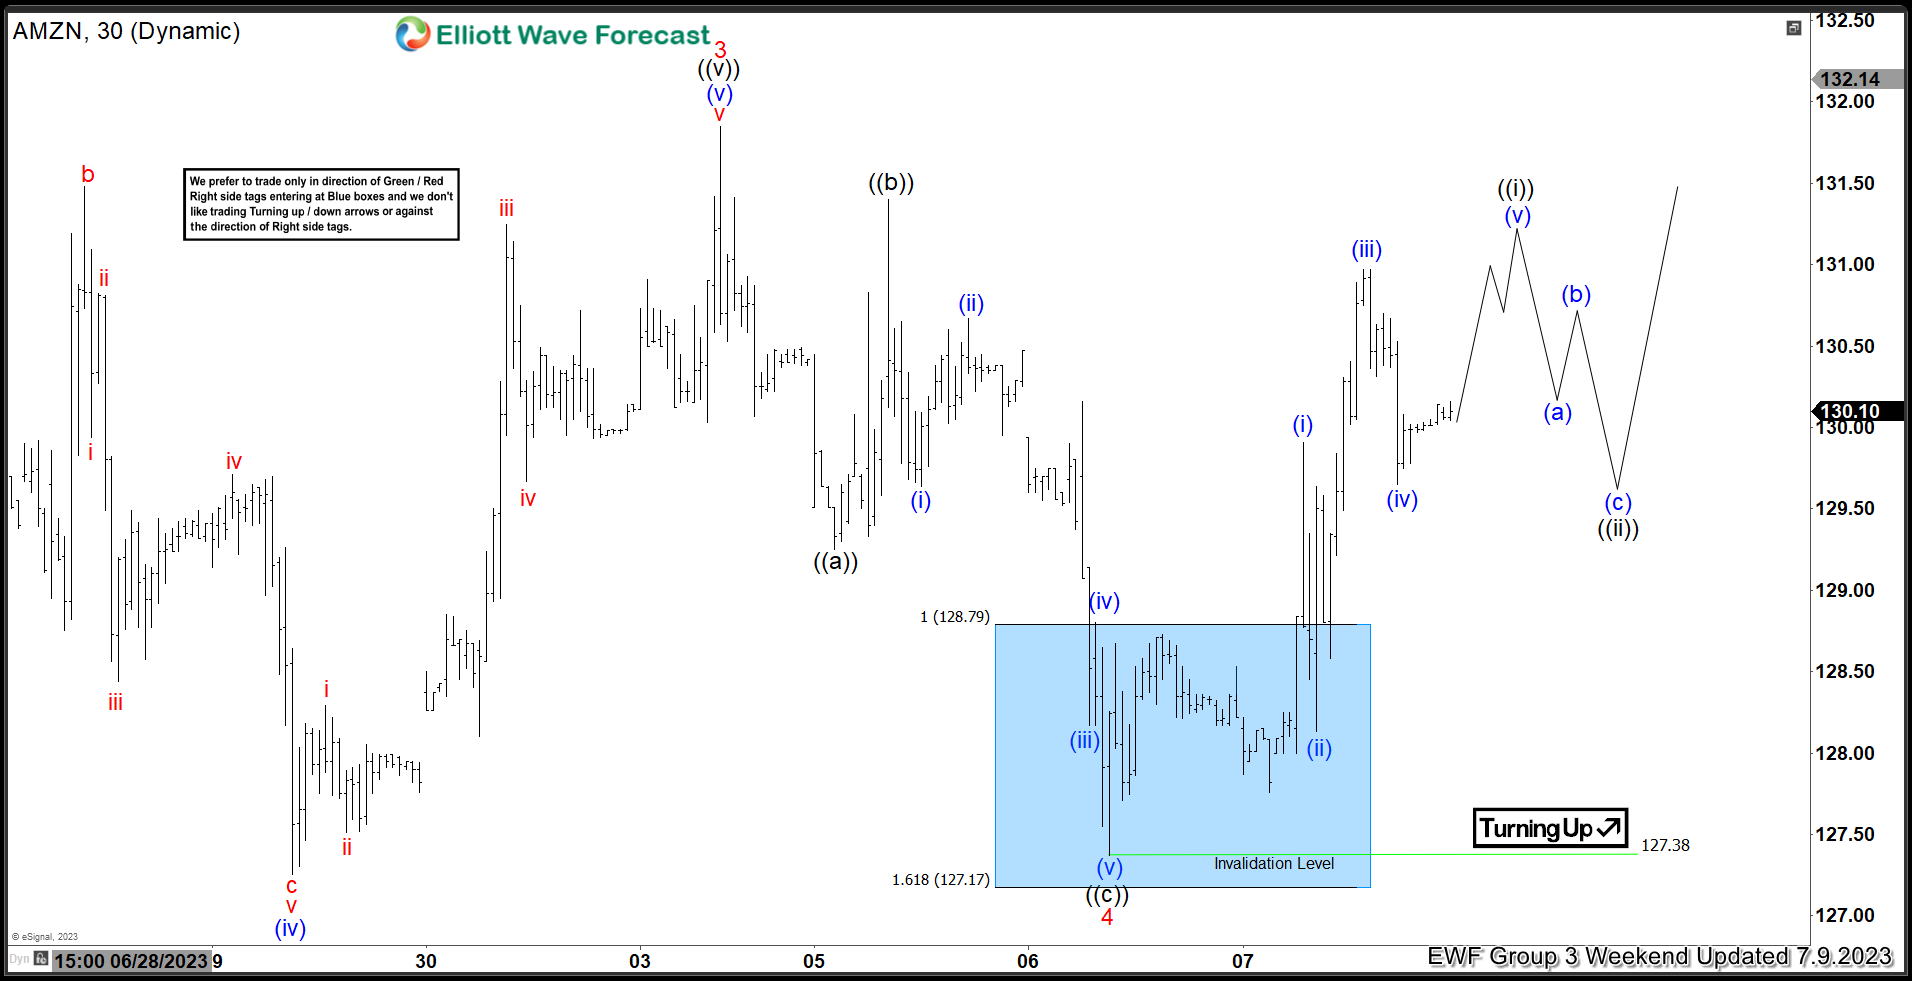
$AMZN 1H Elliott Wave Chart 7.09.2023:
Here is the 1H weekend update from 7.09.2023 showing the move taking place as expected. The stock has reacted higher from the blue box allowing longs to get a risk free position. The pullback can become 7 swings where we will like to buy it again should that happen. Near term, we like it higher towards a new high for the year towards $150.
Source: https://elliottwave-forecast.com/stock-market/amazon-com-inc-amzn-reacts-higher-blue-box-area/