SMI is a Swiss Market Index representing a capitalization-weighted measure of the 20 most significant stocks on the SIX Swiss Exchange in Zurich; the ticker is $SMI. In the initial blog article from November 2020, we were calling the “COVID-19” drop in February-March 2020 to become a significant low in world indices. We were right. Then, in the blog from August 2021, we were expecting more upside and then correction against March 2020 lows. As a matter of fact, it has happened as expected. Now, SMI has accomplished the nest from 2020 lows and next bullish cycle might have started. Here, we provide an update, discussing the wave structure and the next targets.
SMI Monthly Elliott Wave Analysis 06.27.2023
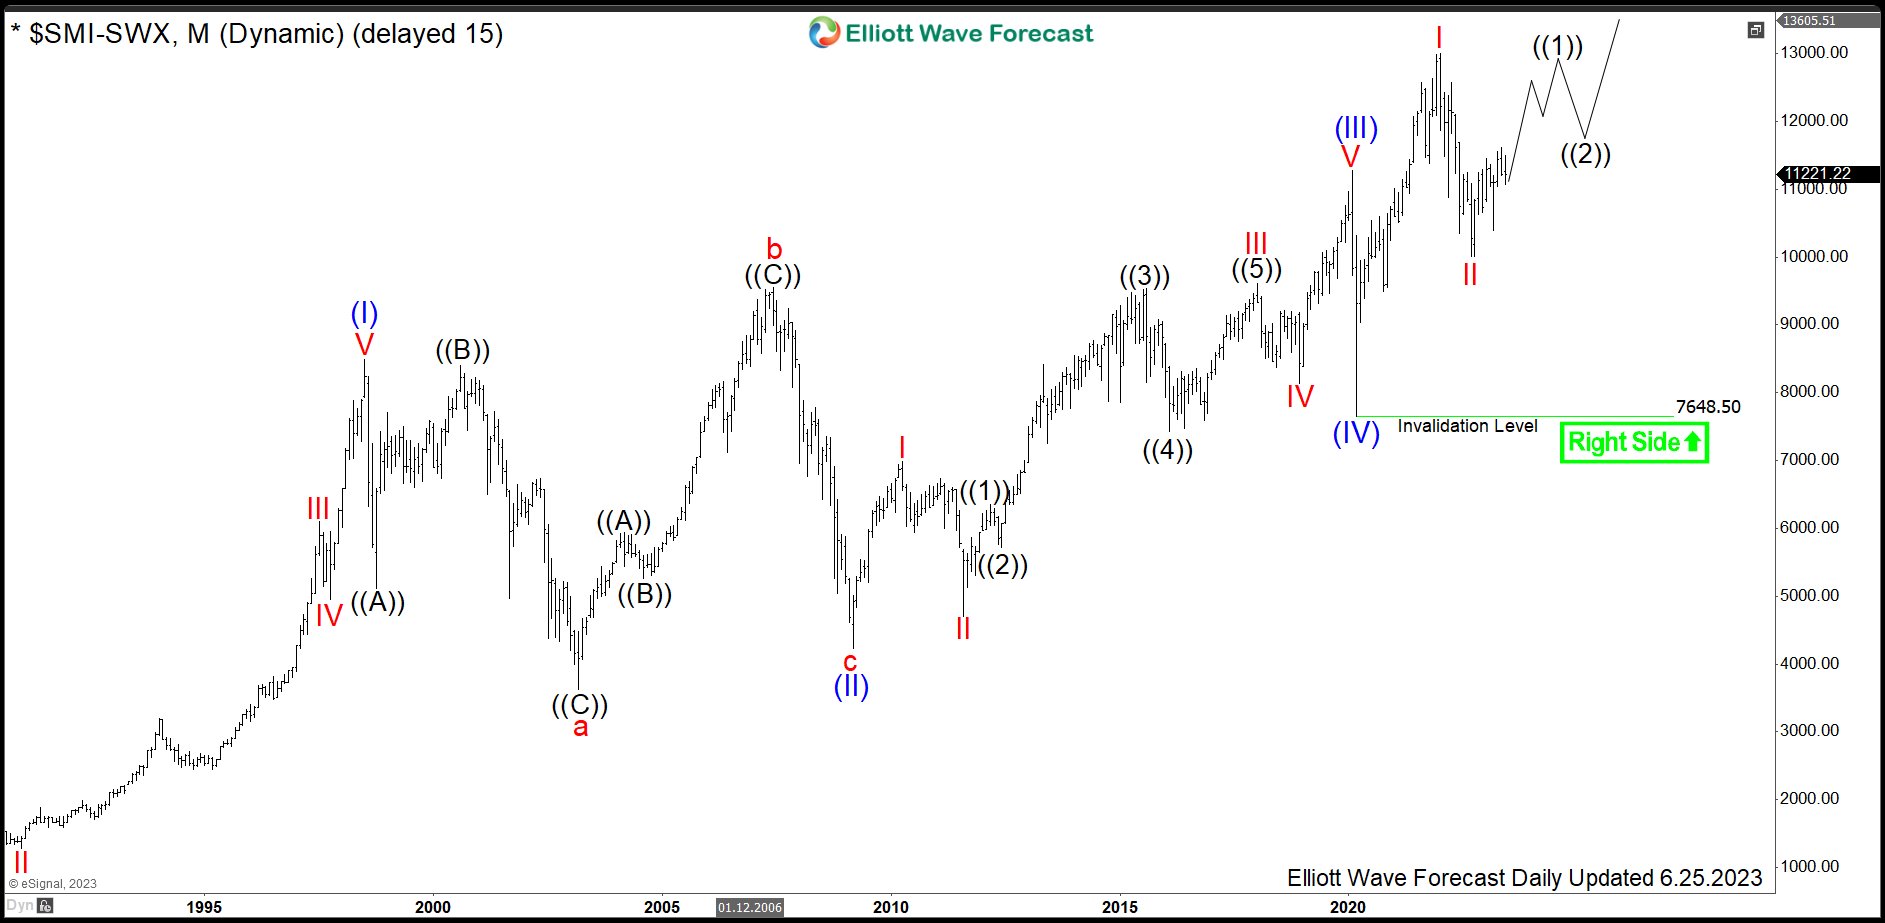
The monthly chart below shows the SMI index $SMI listed at SIX Swiss. From the all-time lows, the index price has developed a cycle higher in wave (I) of a super cycle degree. It has ended by printing a high in July 1998 at 8491. From the highs, a correction lower in wave (II) has retraced during following 10 years a half of the of the motive cycle higher towards March 2009 lows at 4216. Technically speaking, the decline can be an Elliott Wave running flat pattern.
From the lows at 4216, another cycle higher in wave (III) has been confirmed by breaking 8491 highs. Later on in February 2020, it has printed a top at 11272. From the highs, a sharp decline in wave (IV) has unfolded as a straight down correction. It has found its bottom in March 2020 at 7648.5. While above there, SMI is trading already within wave (V). Indeed, break above 11272 highs has confirmed that. Hereby, the index has printed new all-time highs at 12997. It is the preferred view, that red waves I-II have built a nest within blue wave (V). Now, while above 10010 lows, red wave III of blue wave (V) can extend towards 13333-14238 area and even higher.
SMI Daily Elliott Wave Analysis 06.27.2023
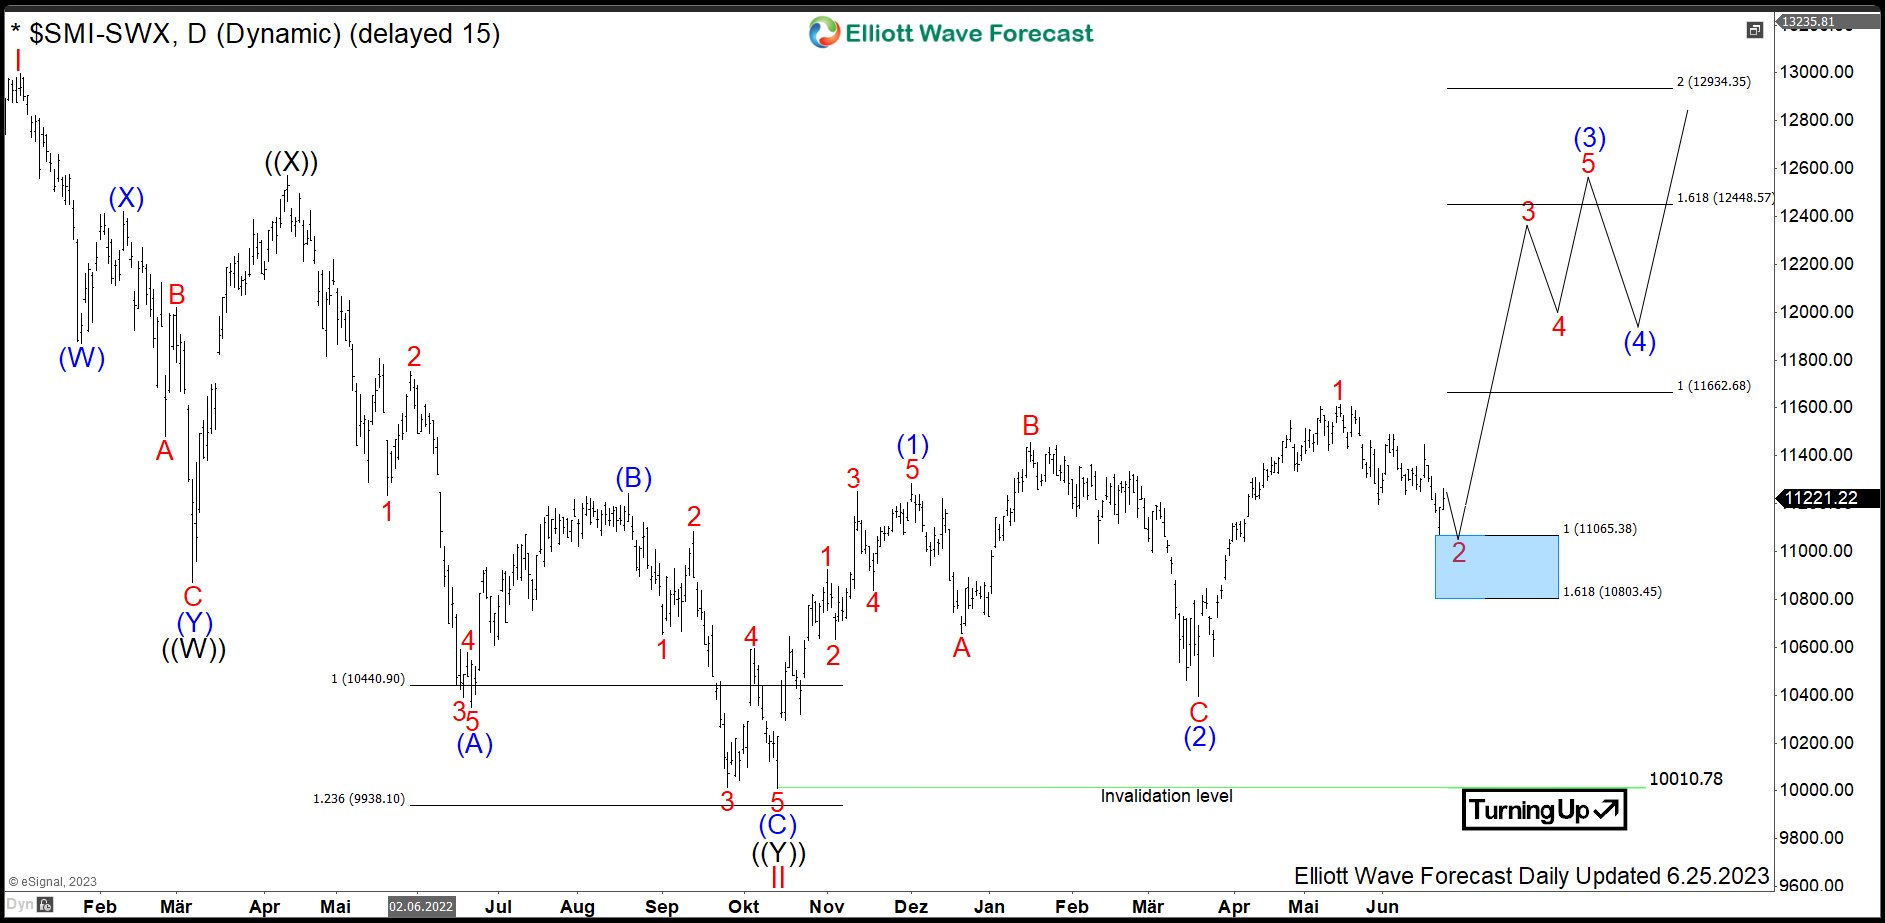
The daily chart below shows in more detail the consolidation lower in red wave II and the initial stages of the bullish cycle in red wave III. From the all-time highs at 12997, wave II demonstrates a double three correction. Firstly, black wave ((W)) has ended in March 2022 at 10871 lows. Then, a bounce in black wave ((X)) has set a connector at 12570. From the April 2022 highs, a new cycle in wave ((Y)) has been confirmed by breaking the March 2022 lows. It has reached the 10441-9124 equal legs extension area. Now, it is the preferred view that the correction in wave II has ended in October 2022 at 10010 lows and red wave III has started. Indeed, the bounce off the lows has broken the descending price and RSI channels. Also, we see other indices like SPX, NASDAQ, EUROSTOXX turning higher.
From October 2022 lows, blue wave (1) has ended in December 2022 at 11283. From there, wave (2) has unfolded as an expanded flat structure. It has set a bottom in March 2023 at 10395. From there, wave (3) has been confirmed by breaking above January 2023 highs. Hereby, it has opened a bullish sequence. As a consequence, dips in 3, 7, 11 swings should see support against 10395 lows. Within blue wave (3), one can recognize a nest in formation. The pullback in wave 2 is currently retracing part of the rise in wave 1. While below 11490, SMI can reach 11065-10803 blue box area. There, acceleration higher in red wave 3 of blue wave (3) should take place. Therefore, investors and traders can be looking to buy 11065-10803 area targeting 11662-12448 area and even higher.
Source: https://elliottwave-forecast.com/stock-market/smi-swiss-market-index-acceleration/