
Raytheon Technologies Corp (NYSE: RTX) is a leading provider of advanced technologies and services for aerospace and defense industries. The company has a long history of innovation and has been a key player in the defense industry for decades. In this article, we will examine the current Elliott Wave technical structure of RTX. We’ll discuss potential outcomes for investors to consider, providing valuable insights into the stock’s future direction.
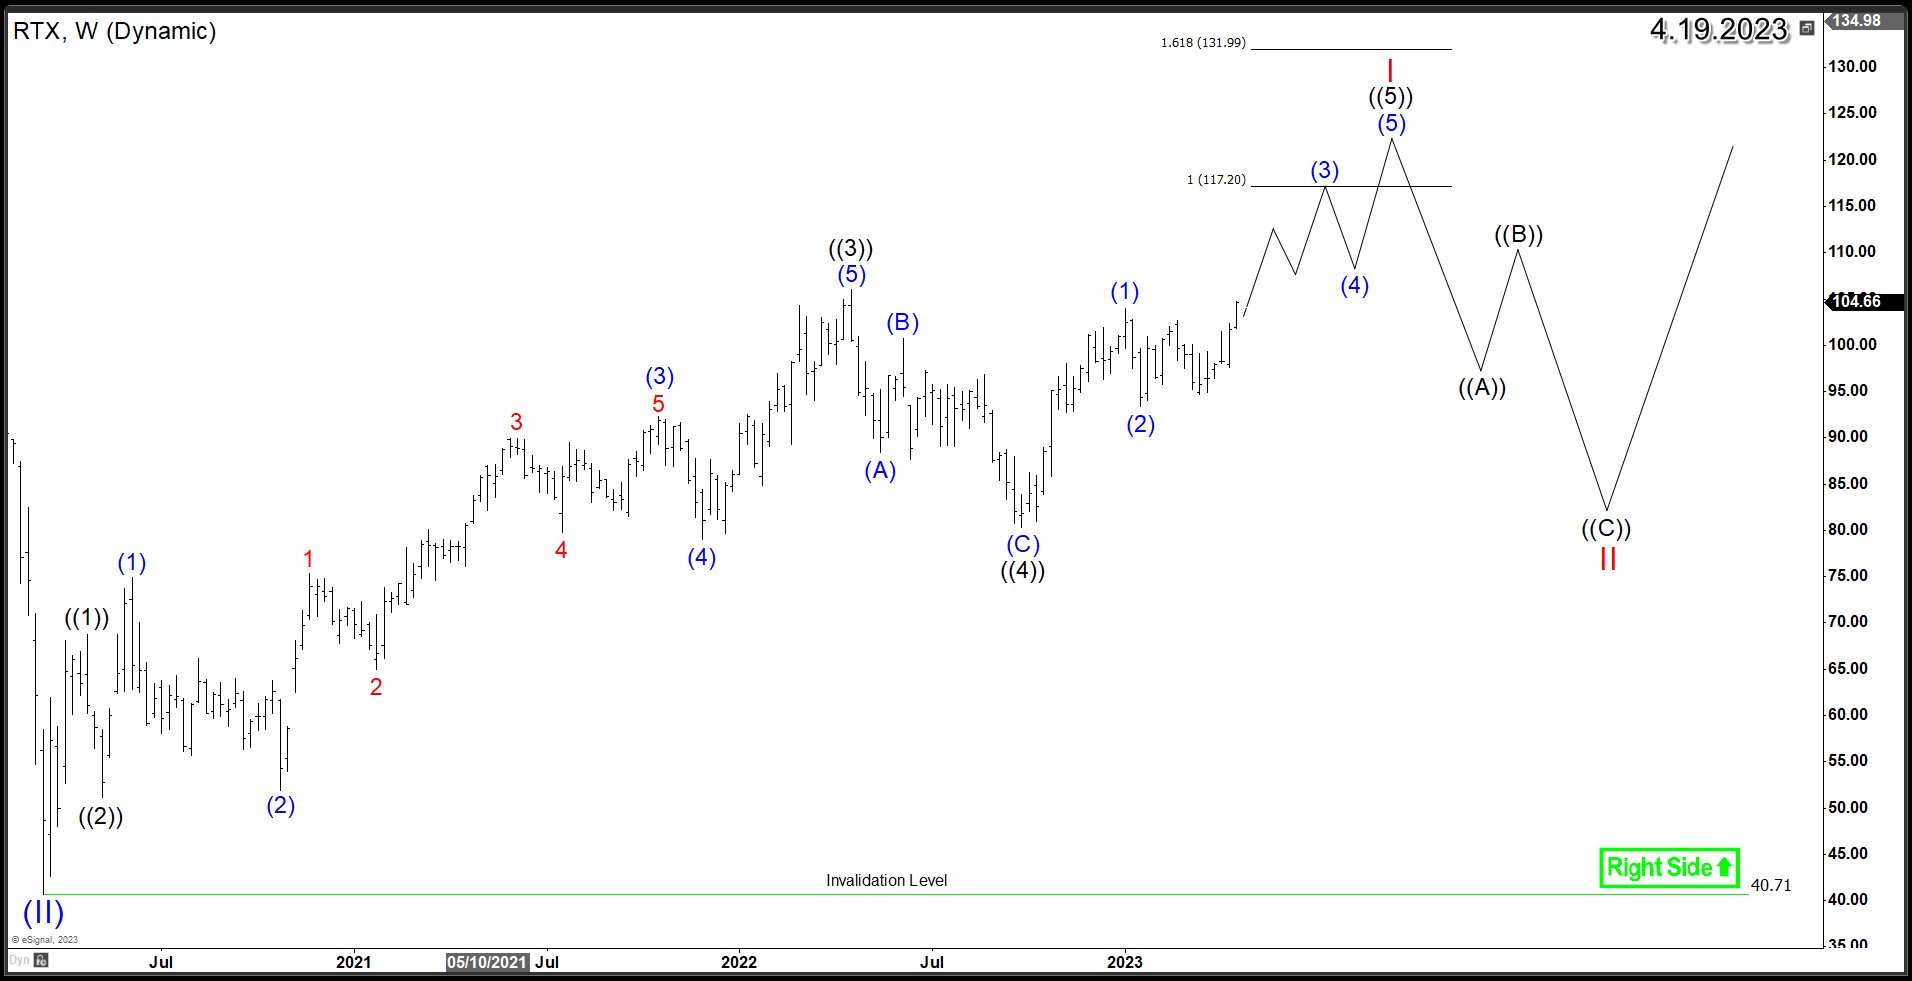
The technical structure of Raytheon Technologies Corp stock shows a promising bullish trend. Since the March 2020 low, the stock has rallied in an impulsive structure with wave ((1)) and ((2)) occurring in April-May 2020, followed by a wave ((3)) rally that ended in April of last year at $106.02. A wave ((4)) correction then took place, ending in September 2022 at $80.27 with three swings lower.
Since that low, RTX established a new bullish sequence after breaking above January 2023 peak of $103.95. This break higher opened the daily upside for the stock toward the equal legs area at $117.2 – $131.9, which is suggesting a move into new all-time highs. After completing its five-wave advance since the March 2020 low, RTX may undergo a larger correction in wave II. This 3 waves pullback will provide a potential buying opportunity for long-term investors who are bullish on the stock.
To support a bullish outlook, the short-term structure of the stock is expected to remain above the key level of January 2023 low at $93.34. As long as pullbacks in the stock remain above this level, RTX will continue to have potential for upside momentum.
RTX Elliott Wave Weekly Chart
Source: https://elliottwave-forecast.com/stock-market/raytheon-technologies-rtx-bullish-rally/