
Adidas is a German multinational corporation designing and manufacturing shoes, clothing and accessories. Created in 1934 by Adolf Dassler and headquartered in Herzogenaurach, Germany, the company is the largest sportswear manufacturer in Europe. Adidas is a part of both DAX40 and of SX5E indices. From the all-time lows, Adidas has been showing a strong bullish behavior. In particular, from the 2008 lows it has gained more than 10x in value. In the initial article from January 2021, we were calling for a new cycle up. We were right, Adidas has printed a new all-time high at 336.25. Later on, in December 2021, we were calling for medium term pullback in 7 swings to find support from 220.76-171.54 area. Indeed, from the bluebox area, the market has bounced in 3 swings. Then, however, stock price decided to step in 11 swings lower. The number and the magnitude of the swings turn the overall correction into a next degree. As a matter of fact, Adidas is correcting in 11 swings against all-time lows providing a big buying opportunity. In this blog, we provide an update.
Adidas Monthly Elliott Wave Analysis 11.27.2022
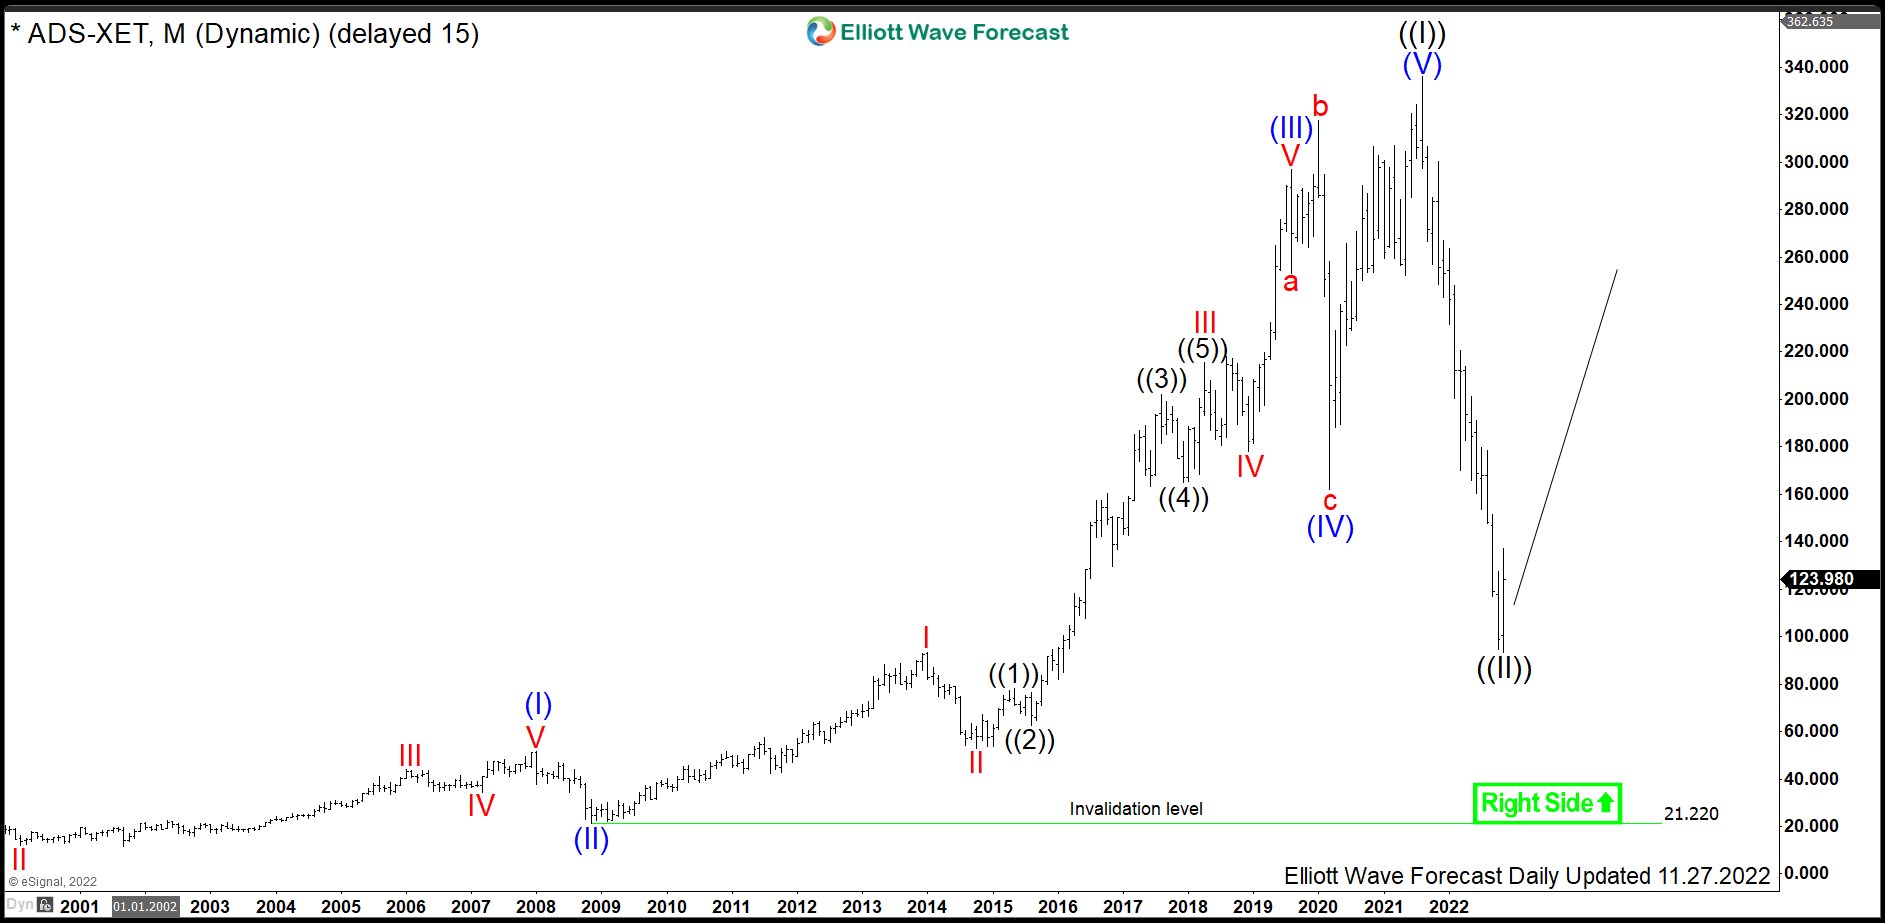
The monthly chart below shows the Adidas stock $ADS traded at XETRA. From the all-time lows, the stock price has developed a cycle higher in blue wave (I) of super cycle degree towards January 2008 highs at 51.63. From there, a correction lower in blue wave (II) has retraced part of the rise. It has printed a bottom on November 2008 at 21.22. From November 2008 lows, a cycle in wave (III) has extended towards August 2019 highs at 296.75. Hereby, the extension beyond 4.236 qualifies the cycle as a 3rd wave. From the August 2019 highs, a correction lower in wave (IV) has unfolded as an expanded flat structure towards the March 2020 lows at 162.20.
From the March 2020 lows, a new cycle in wave (V) has printed the all-time high in August 2021 at 336.25. In fact, the cycle in wave ((I)) of grand super cycle degree has ended. From the August 2021 highs, a correction in wave ((II)) is in progress or might have ended already. Then, a new larger cycle in black wave ((III)) should take place. Therefore, investors can be using that major pullback in black wave ((II)) as a buying opportunity expecting more upside towards 336.25 and higher.
Adidas Daily Elliott Wave Analysis 11.27.2022
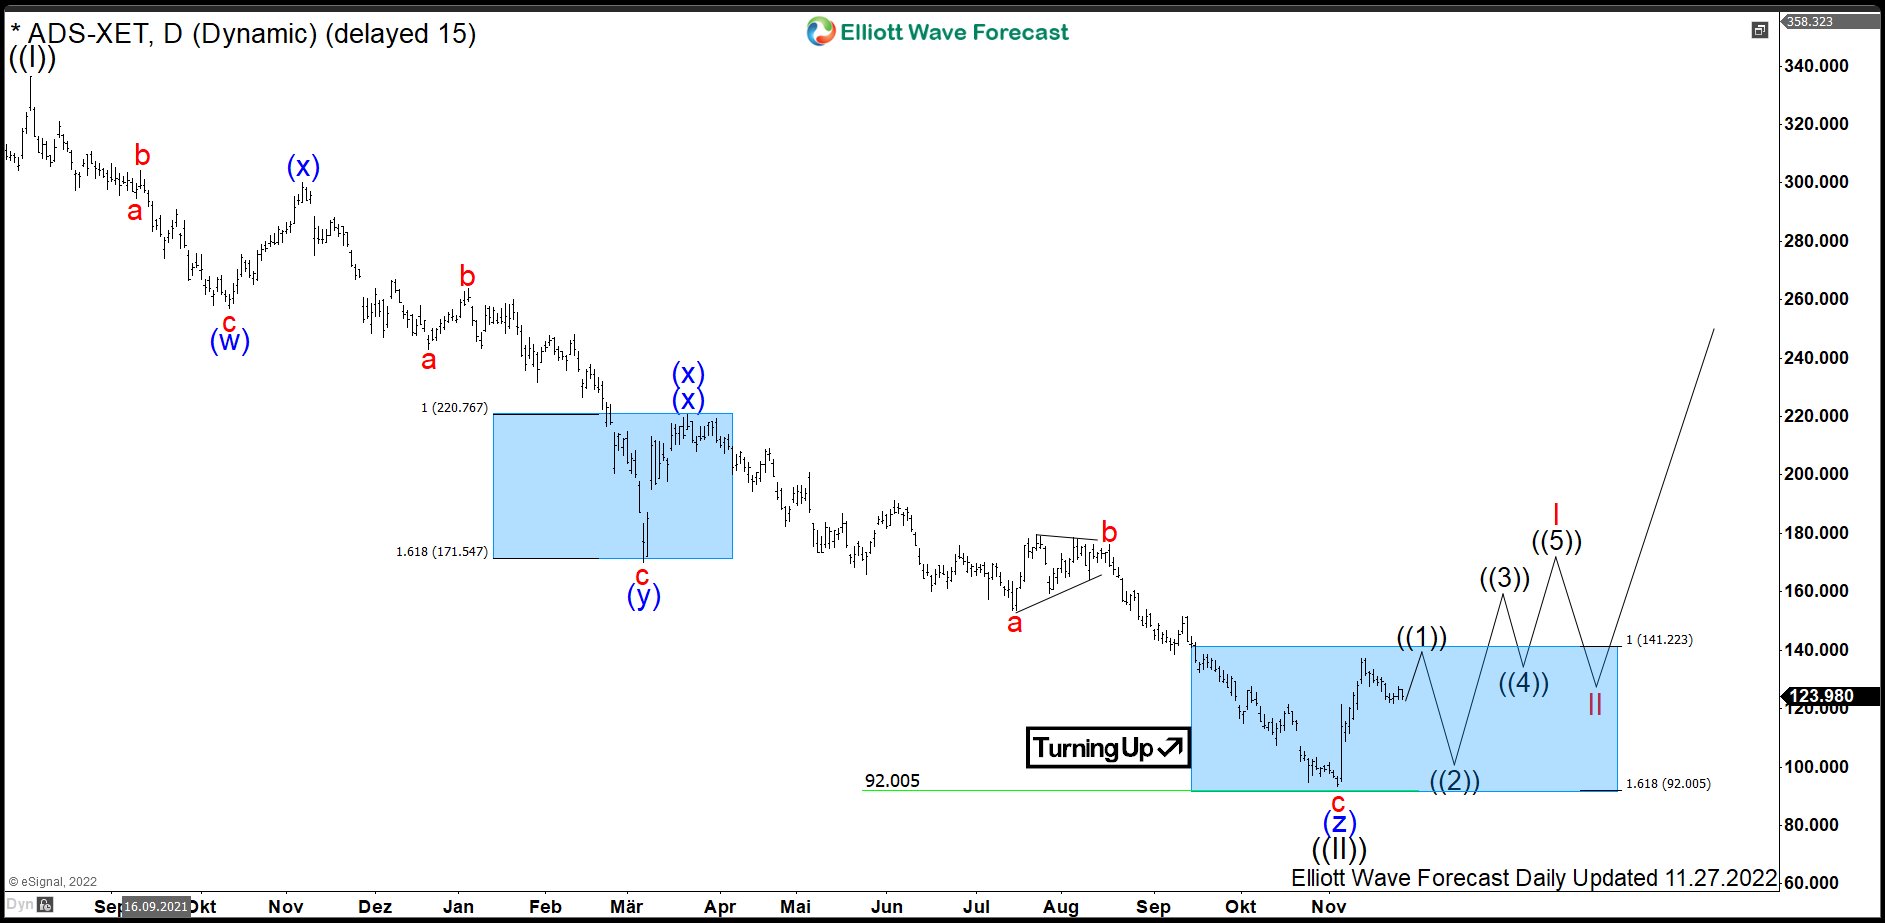
The daily chart below shows in more detail the consolidation from the all-time highs in black wave ((II)). It unfolds as a triple three pattern. Firstly, from the August 2021 highs at 336.25, 3 swings lower of blue (w) have set a low in October 2021 at 257.00. Secondly, a bounce in blue wave (x) has printed a connector high at 300.25. Thirdly, the price reached lower into the blue box extension area 220.76-171.54. In fact, it has slightly broken the lower level by setting a bottom in blue wave (y) at 170.08 in March 2022. From there, another connector in blue wave (xx) has ended at 220.80 highs. While below, another cycle in blue wave (z) has reached another extension area 141.22-92.00. There, a reaction higher in black wave ((III)) or a bounce in 3 waves as minnimum should take place.
Investors and traders can be using 141.22-92.00 bluebox area as a buying opportunity in $ADS targeting 429.50-637.60 area and even higher in the long run.
Source: https://elliottwave-forecast.com/stock-market/adidas-stepped-11-swings-big-buy/