
Sony Group Corporation, commonly known as Sony and stylized as SONY, is a Japanese multinational conglomerate corporation headquartered in Kōnan, Minato, Tokyo, Japan. As a major technology company, it operates as one of the world’s largest manufacturers of consumer and professional electronic products, the largest video game console company and the largest video game publisher.
SONY Weekly Chart July 8th 2022
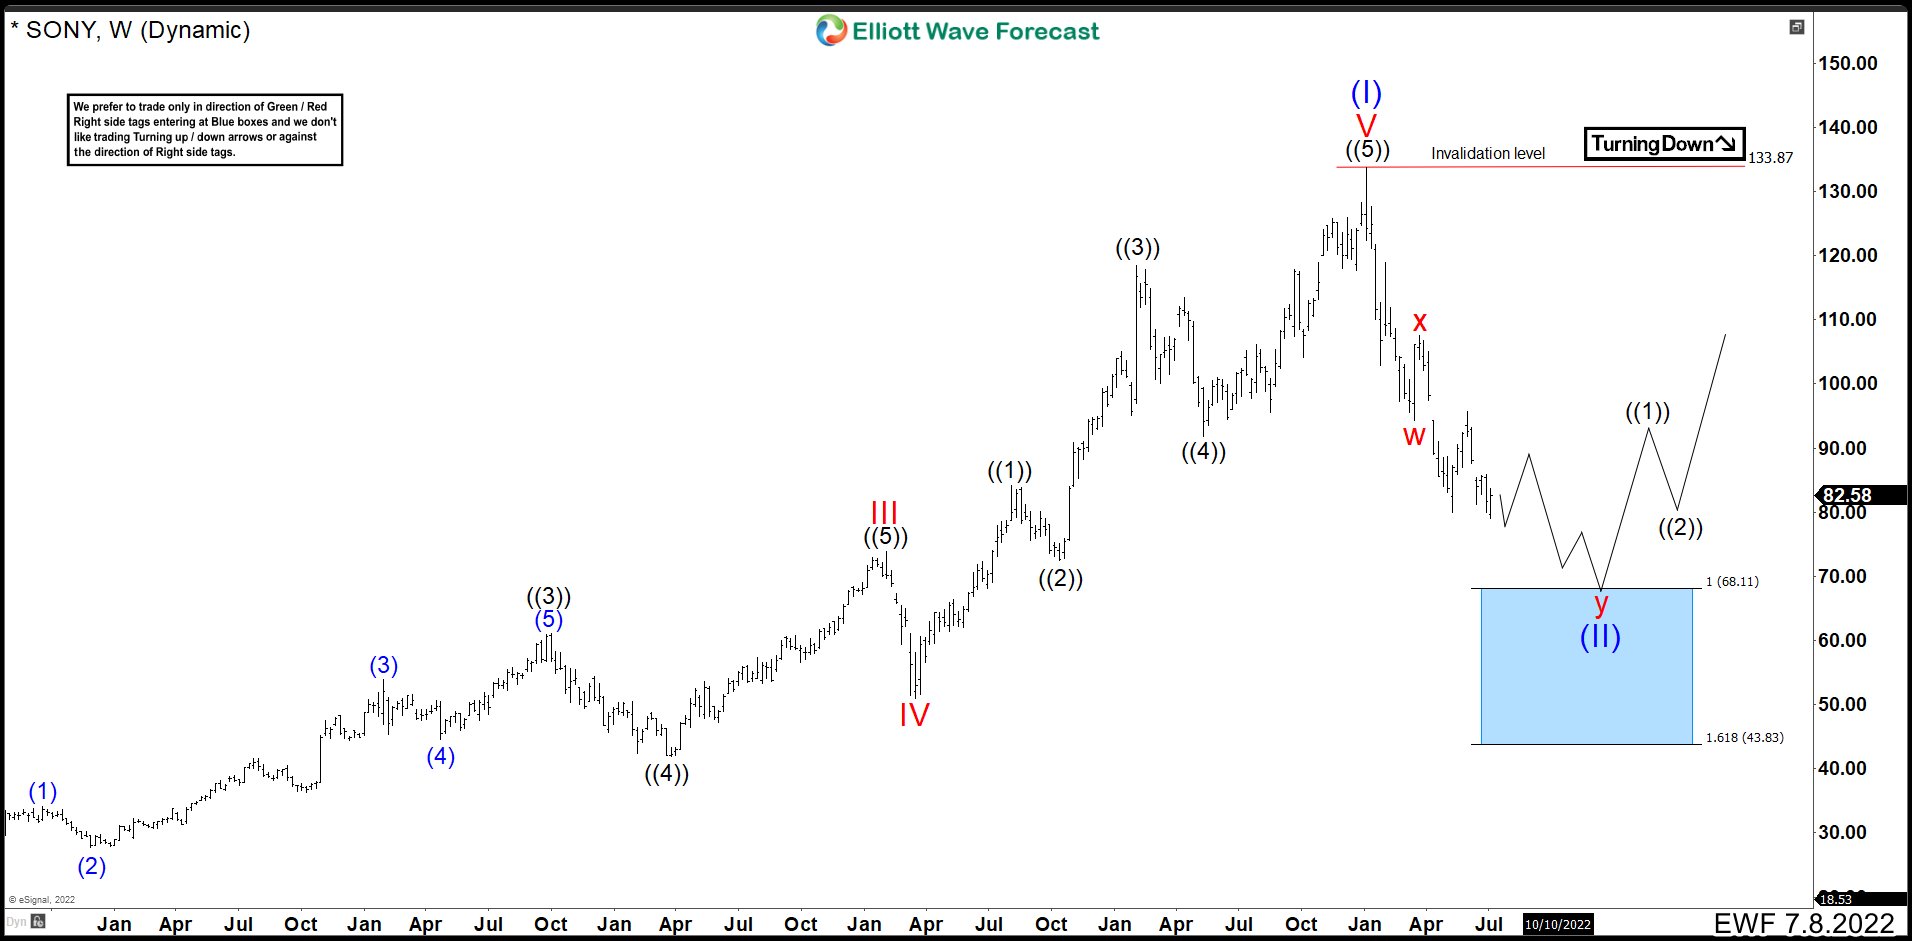
SONY ended an impulse that began at the end of 2012. The share price reached 133.75 in January 2021, that is, 9 years of upward movement. We called this impulse wave (I). From here the price started to fall forming a double correction structure. This would take us to the blue box 68.11 – 43.83 area to complete wave (II) correction and resume the rally.
SONY Weekly Chart November 27th 2022
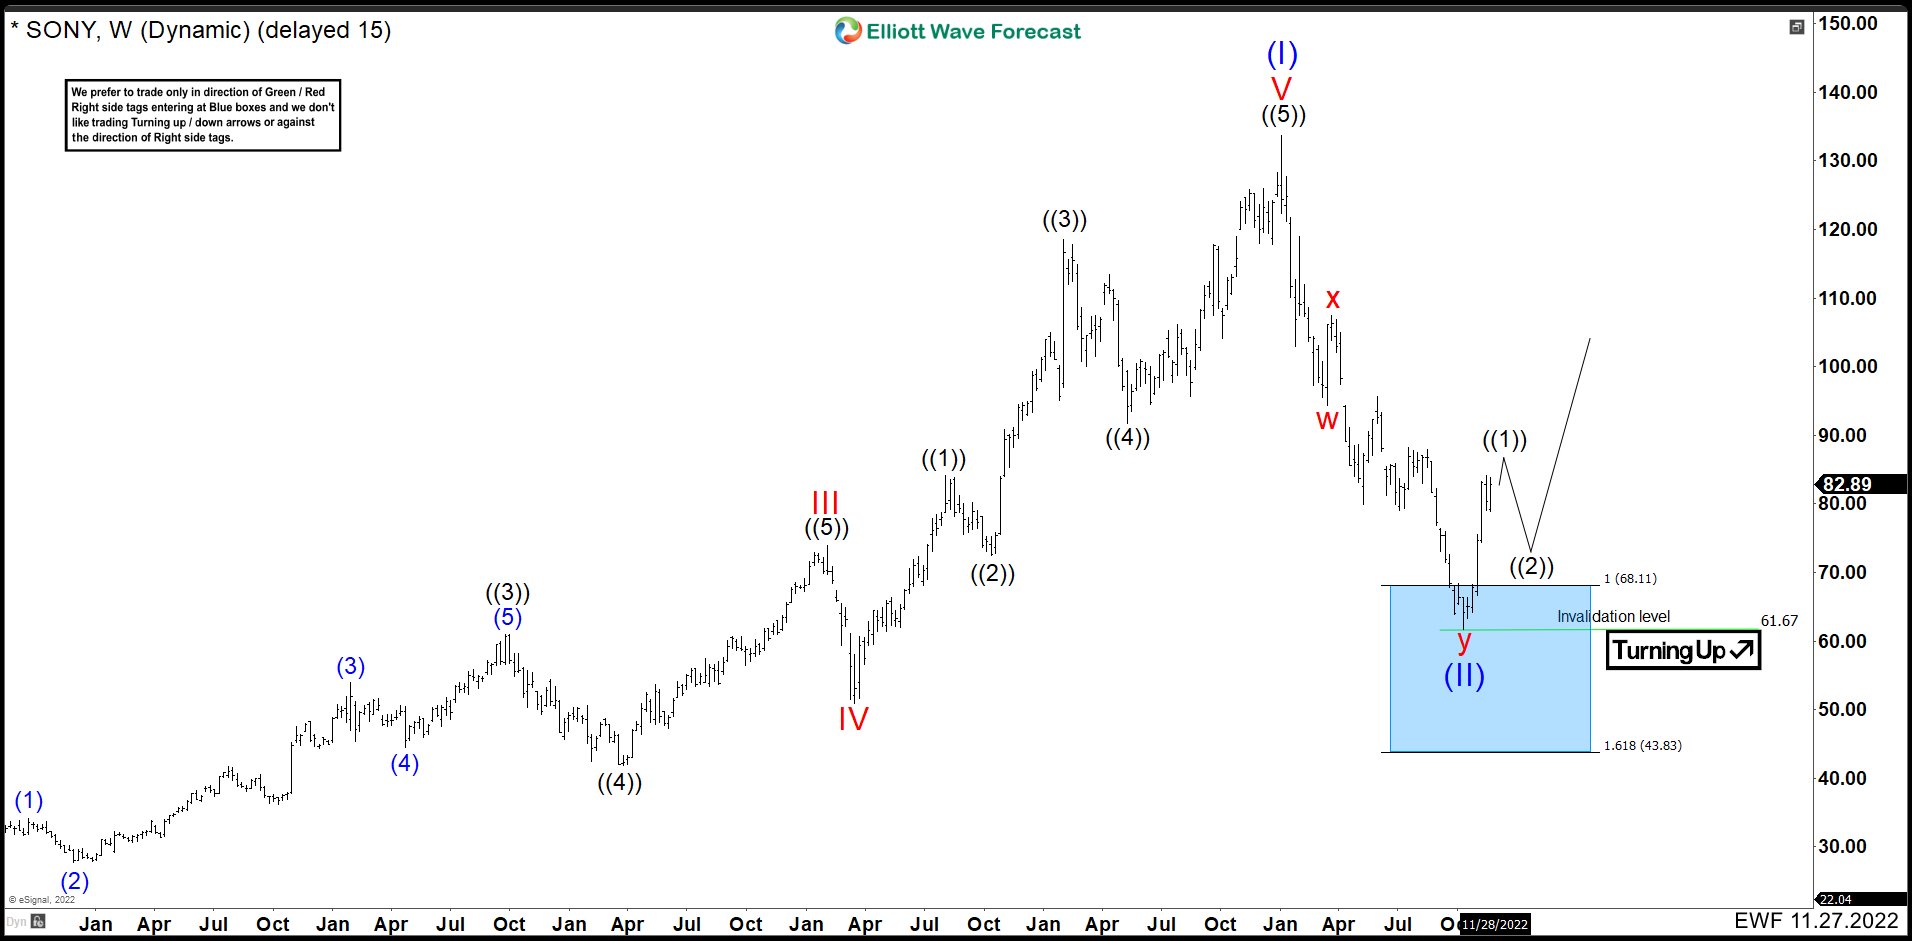
After almost 5 months, double correction as wave (II) finished. The first 3 swings ended wave w at 94.40. Connector wave x finish at 107.79. Down from wave x market made 3 swings lower to complete y. Wave (a) ended at 80.05 and bounced as wave (b) ended at 95.96. Last drop as wave (c) made an impulse to the blue box area ending wave y and wave (II) at 61.67. The rally has already begun and in the near term we need more upside to complete an impulse. The best area to complete wave ((1)) comes at 85.23 – 87.16. After this, it should fall in 3, 7 or 11 swings lower to complete wave ((2)). As we stay above 61.67, the view is valid.
Source: https://elliottwave-forecast.com/stock-market/sony-ended-correction-higher-blue-box/