
Silver Miners ETF (SIL) may have ended the correction to the cycle from March 2020 low. The correction took the form of a double as the chart below shows:
A double three is labelled as WXY. The first leg wave W and the third leg Y both subdivide into 3 corrective waves. The subdivision of each leg can be either zigzag, flat or another double three but in lesser degree. We can see the double three correction in the daily chart of Silver Miners ETF (SIL), labelled as (W)-(X)-(Y).
SIL (Silver Miners ETF) Monthly Elliott Wave Chart
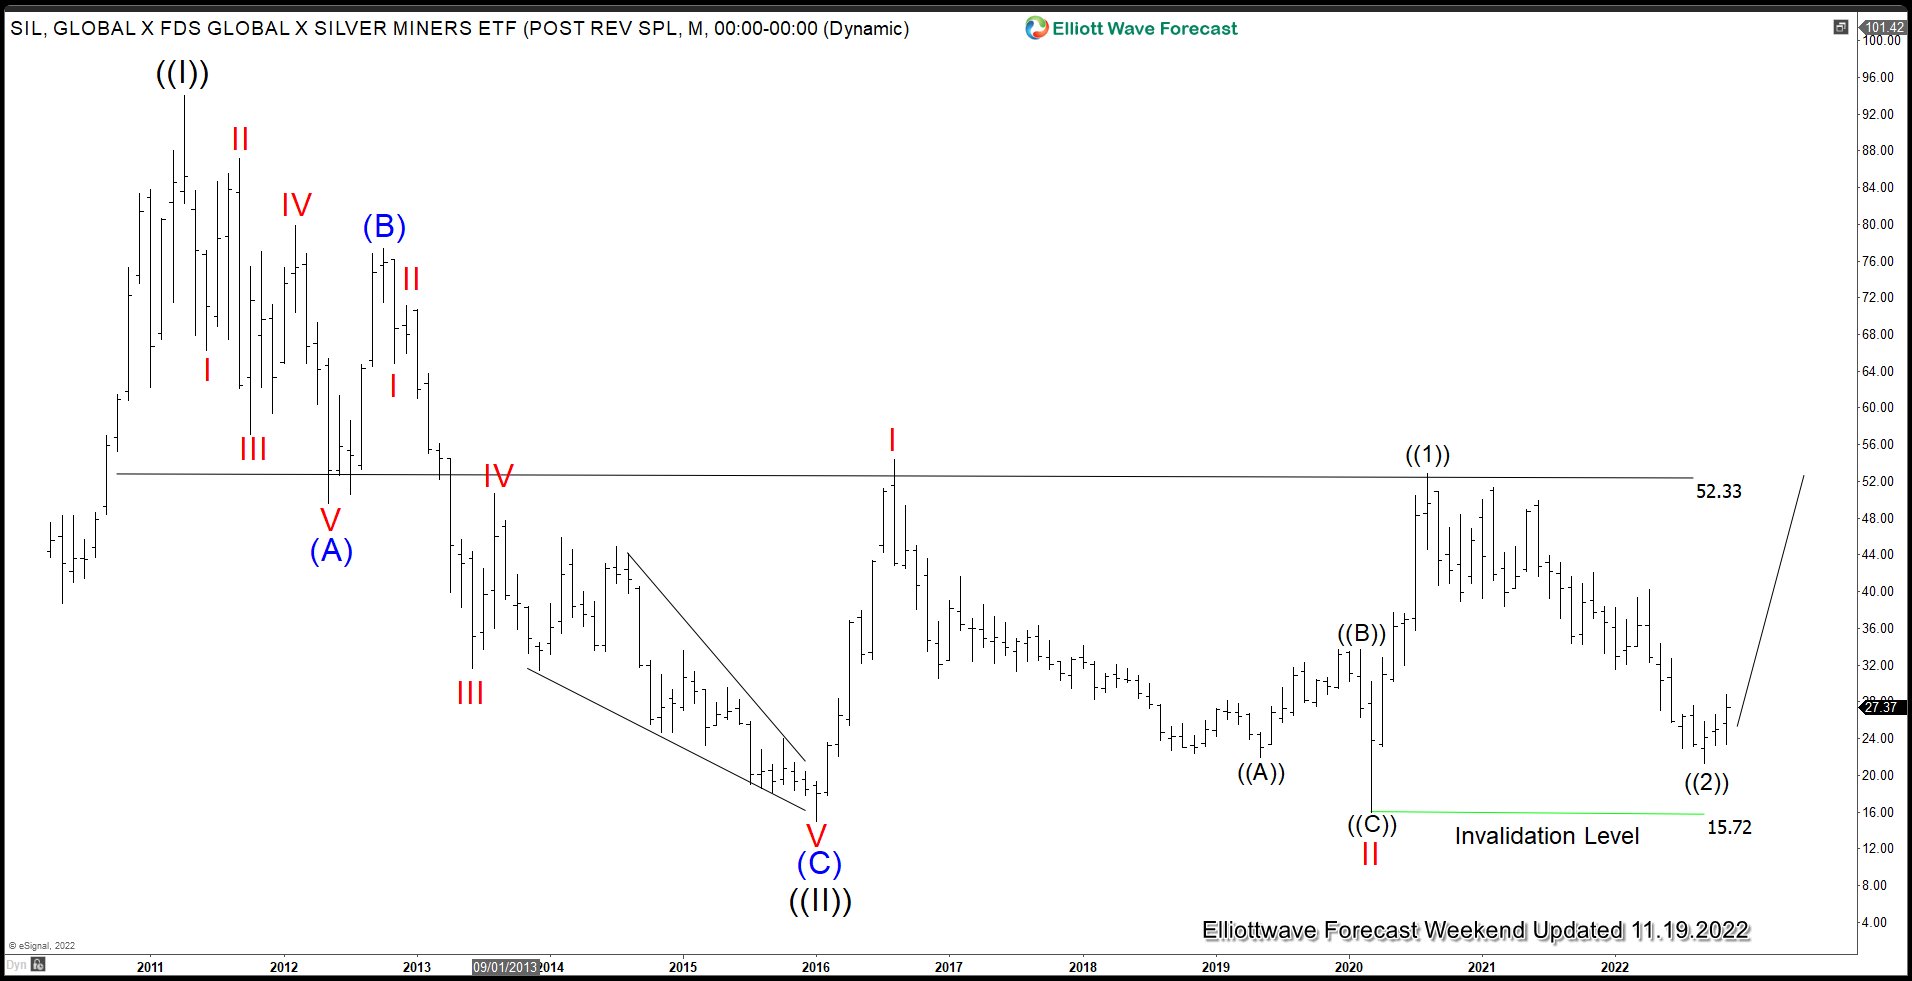
Monthly Elliott Wave chart of SIL above suggests that the ETF has been sideways since forming the low in 2016 at 14.94. We are calling the move higher from there as a nest where wave I ended at 54.34 and secondary low wave II ended at 15.72. Wave III is now in progress as an impulse where wave ((1)) ended at 52.87. Wave ((2)) may have completed already at 21.26. However, we still need more separation from the low to get higher confidence of this view. Regardless, while above 15.72, the instrument should see further upside.
SIL (Silver Miners ETF) Daily Elliott Wave Chart
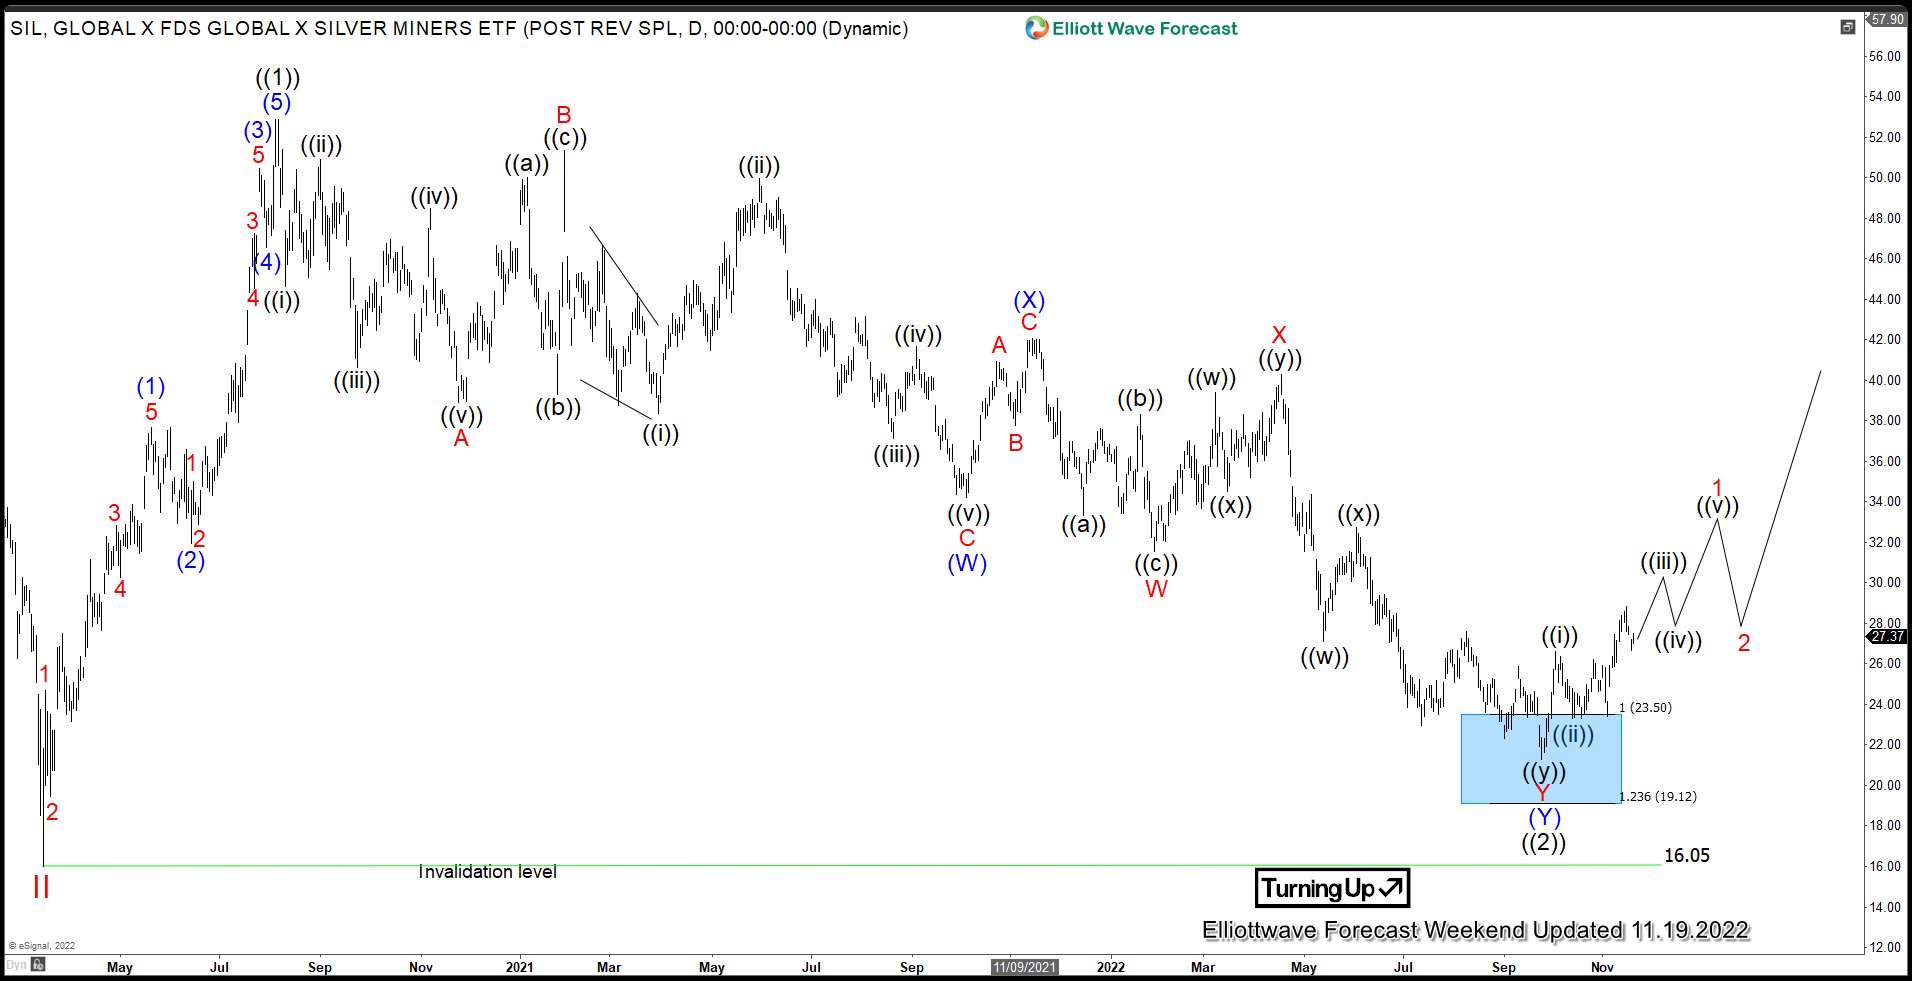
Daily SIL (Silver Miners ETF) Chart above suggests that the ETF has reached extreme area from 8.5.2020 high. The blue box area is the 100% – 123.6% Fibonacci extension from wave ((1)) peak in relation to wave (W) and (X). Although it’s still too early to conclude with high confidence that wave ((2)) has ended, the instrument starts to run out of space for further downside. Regardless, a marginal low still can’t be ruled out but dips likely stay above the 3.16.2020 invalidation level low of 16.05 for further upside.
Source: https://elliottwave-forecast.com/stock-market/elliott-wave-view-sil-silver-miners-may-bottomed/