
In this technical blog, we will look at the past performance of the 4-hour Elliott Wave Charts of Bitcoin. In which, the decline from 15 August 2022 high ended 5 waves in an impulse sequence and showed a lower low sequence in a higher time frame charts. Therefore, we knew that the structure of Bitcoin is incomplete to the downside & should see more weakness. So, we advised members to sell the bounces in 3, 7, or 11 swings at the blue box areas. We will explain the structure & forecast below:
Bitcoin 4-Hour Elliott Wave Chart
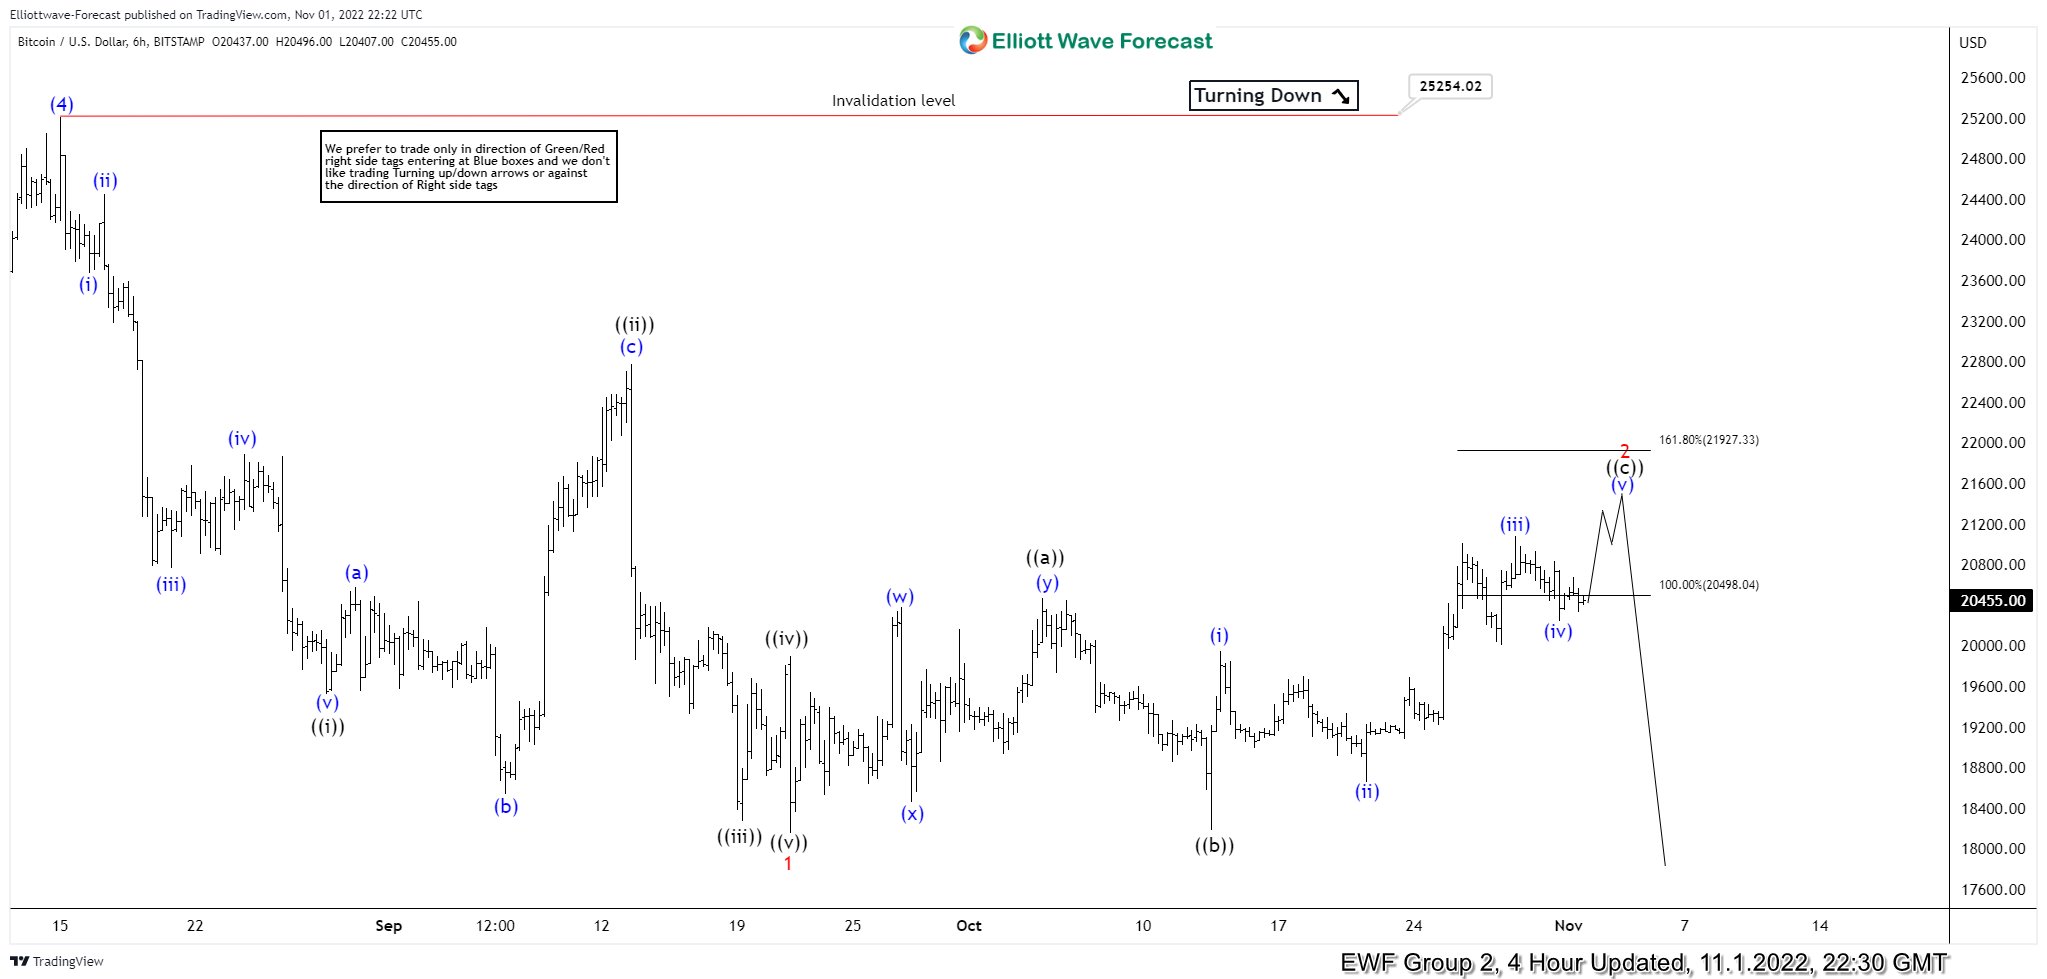
Here’s 4hr Elliott wave Chart from the 11/01/2022 update. In which, the decline to $18157 low ended 5 waves from the 15 August 2022 high as a diagonal in wave 1 & made a bounce in wave 2. The internals of that bounce unfolded as an Elliott wave flat correction where wave ((a)) ended at $20469 high. Then a decline to $18183 ended wave ((b)) pullback and started the ((c)) leg higher towards $20498- $21927 equal legs area from where sellers were expected to appear looking for more downside or for a 3 wave reaction lower at least.
Bitcoin Latest 4-Hour Elliott Wave Chart

This is the Latest 4hr view from the 11/14/2022 update. In which the Bitcoin is showing a strong reaction lower taking place from the equal legs area allowing shorts to get into a risk-free position shortly after taking the position.
Source: https://elliottwave-forecast.com/cryptos/bitcoin-failed-equal-legs-area/