
In this technical blog we’re going to take a quick look at the Elliott Wave charts of Amazon $AMZN. As our members know, Amazon stock has been showing incomplete bearish sequences in the cycle from the August 16th peak. We recommended members to avoid buying the stock and keep favoring the short side due to incomplete sequences. Cycle from the 146.6 peak was incomplete and we knew the drop was coming . In the further text we are going to explain the Elliott Wave Forecast.
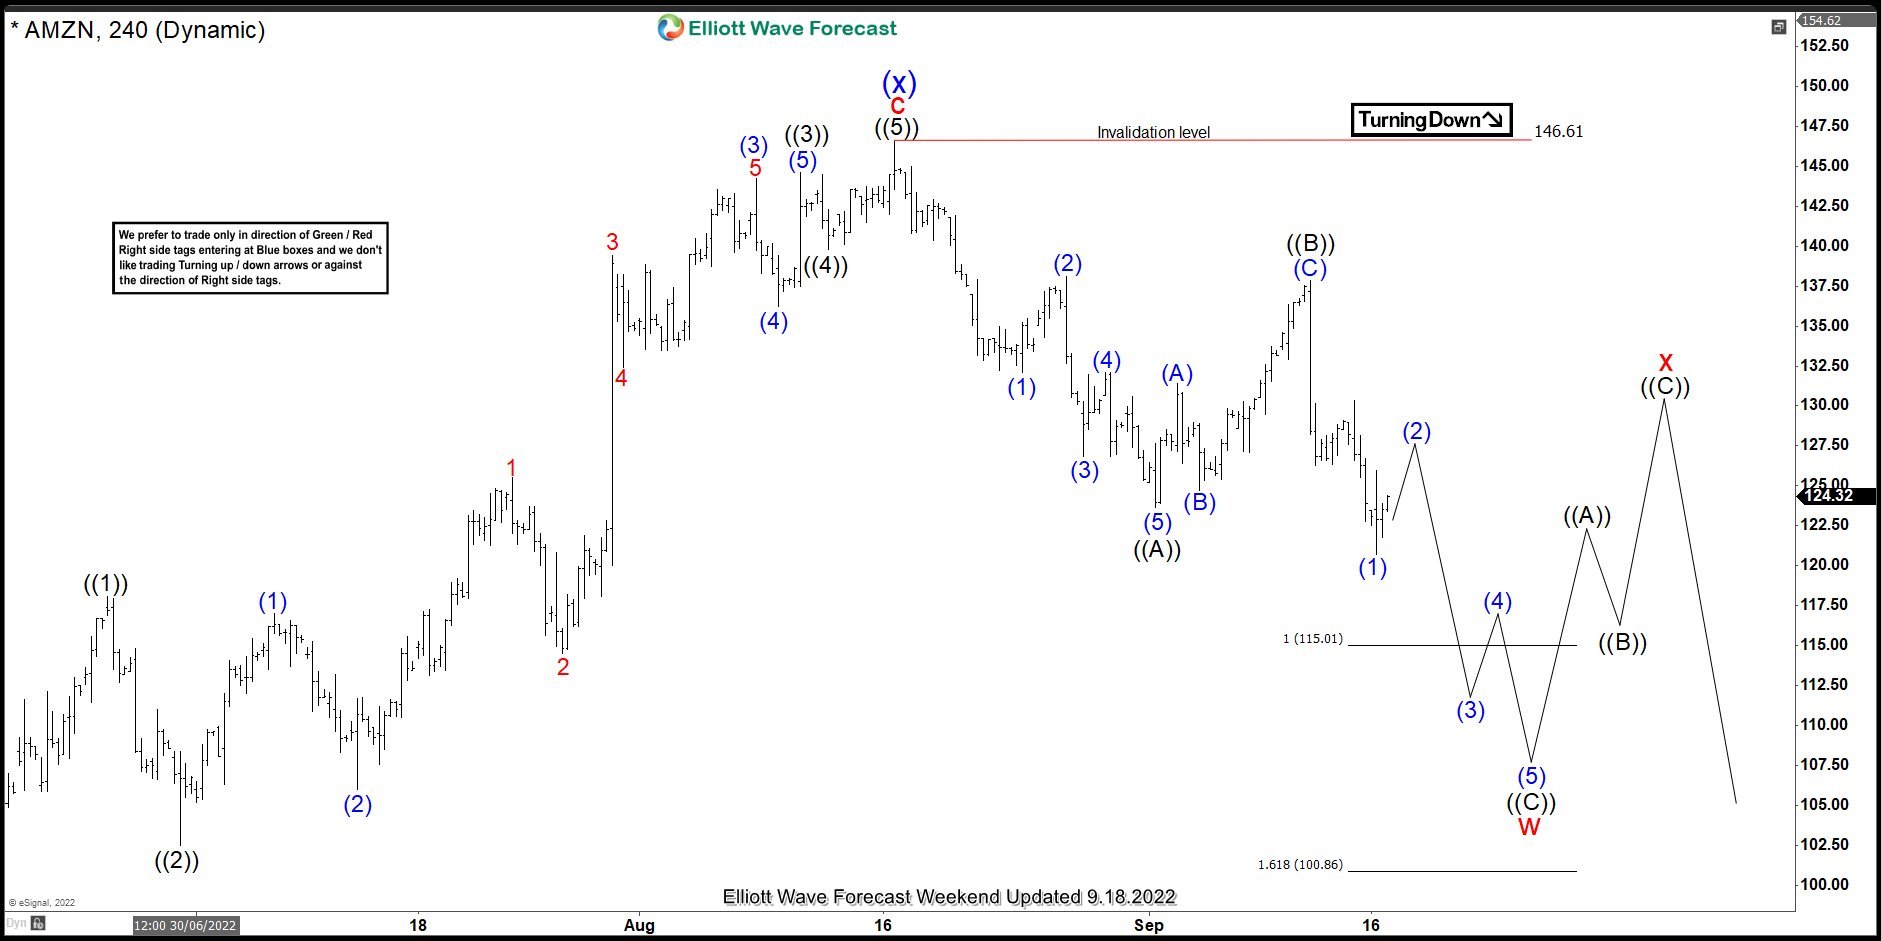
Amazon $AMZN Elliott Wave Analysis 09.18.2022
Decline from the 146.61 unfolded as 5 waves structure- ((A)) black, after which we got 3 waves bounce in ((B)) . Eventually the stock made turn lower again break of of the September 1st low which made incomplete bearish sequences. Amazon stock is showing lower low structure from the 146.61 peak. The stock is targeting 115.01-100.86 area where it is expected to complete Elliott Wave Zig Zag Pattern. From that zone we expect to see larger bounce in 3 waves at least.
Reminder: You can learn about Elliott Wave Rules and Patterns at our Free Elliott Wave Educational Web Page.
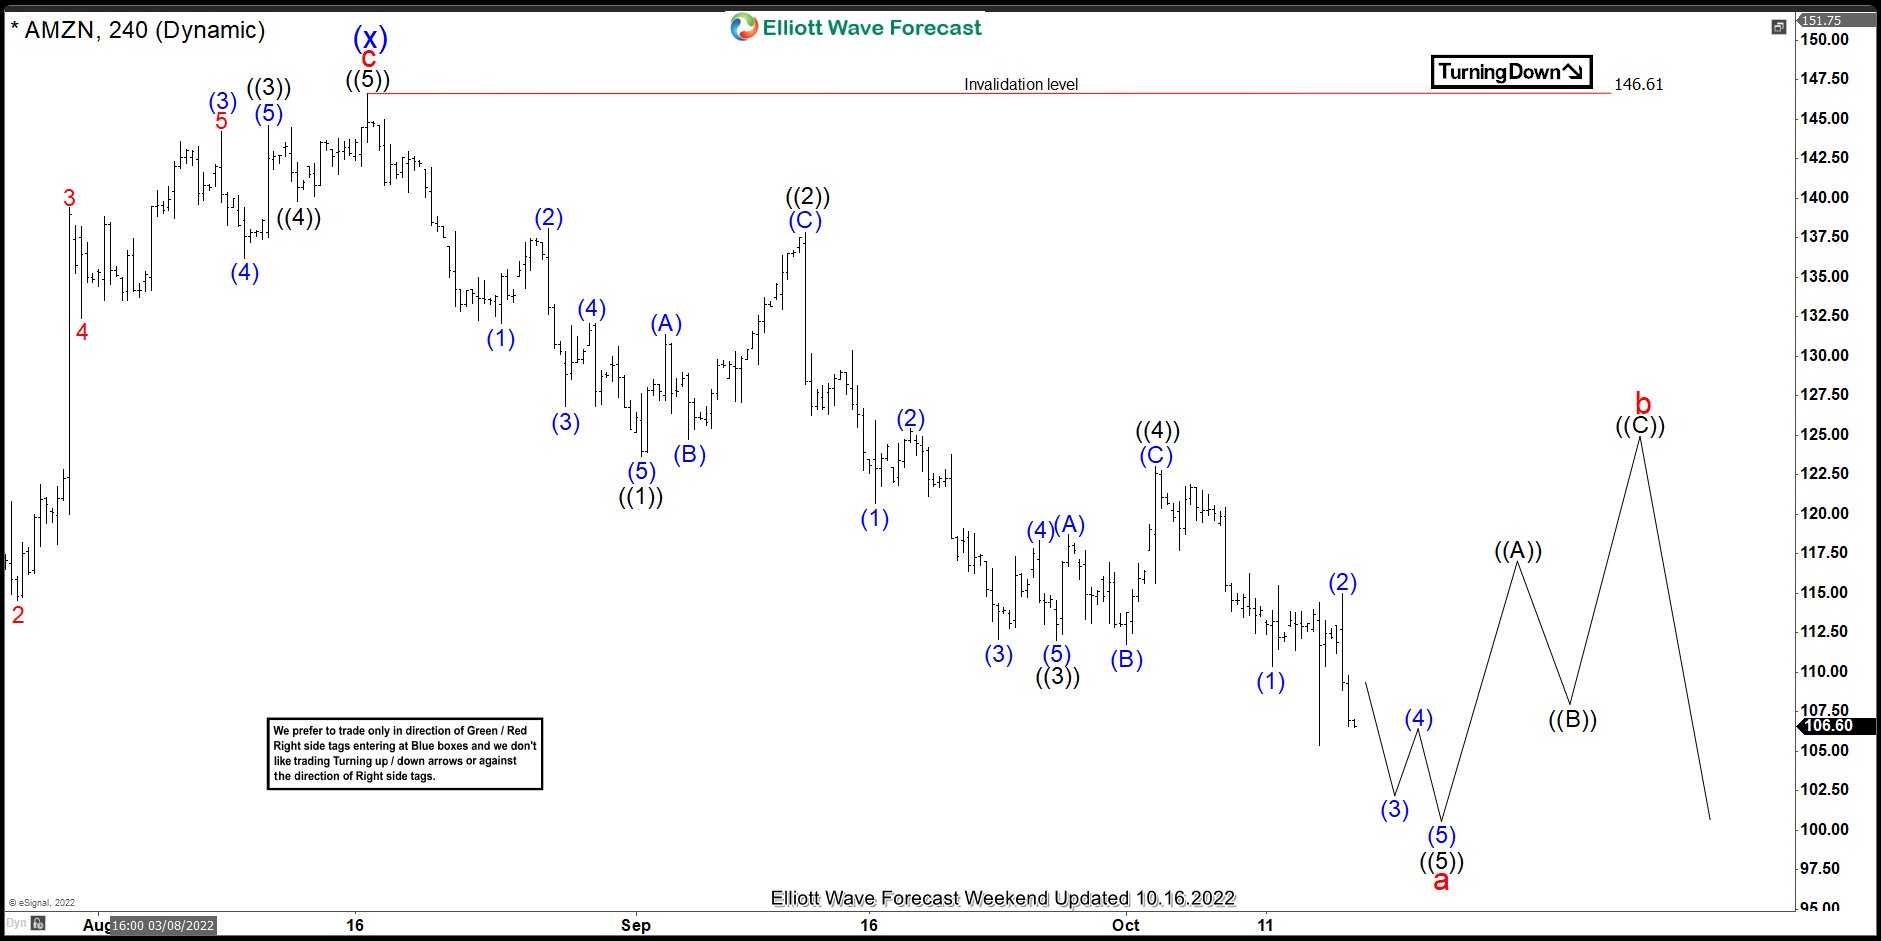
Amazon $AMZN Elliott Wave Analysis 10.02.2022
The stock continued trading lower as expected. The price has reached target at 115.01-100.86. We got 3 waves bounce from there and another break down. Current view suggests cycle from the 146.61 looks to be unfolding as 5 waves structure rather than Zig Zag.
Keep in mind that market is dynamic and presented view could have changed in the mean time. You can check most recent charts in the membership area of the site. Best instruments to trade are those having incomplete bullish or bearish swings sequences. We put them in Sequence Report and best among them are shown in the Live Trading Room.
Source: https://elliottwave-forecast.com/stock-market/amazon-incomplete-sequences-decline/