
In this technical blog, we will look at the past performance of 4 hour Elliott Wave Charts of AUDUSD. In which, the decline from 25 February 2021 high is unfolding as a 7 swing corrective structure and showing a lower low sequence favoring more downside. Therefore, we knew that the structure in AUDUSD is incomplete to the downside & should see more weakness. So, we advised members not to buy the pair & sell the bounce in 3, 7, or 11 swings at the blue box areas. We will explain the structure & forecast below:
AUDUSD 4 Hour Elliott Wave Chart
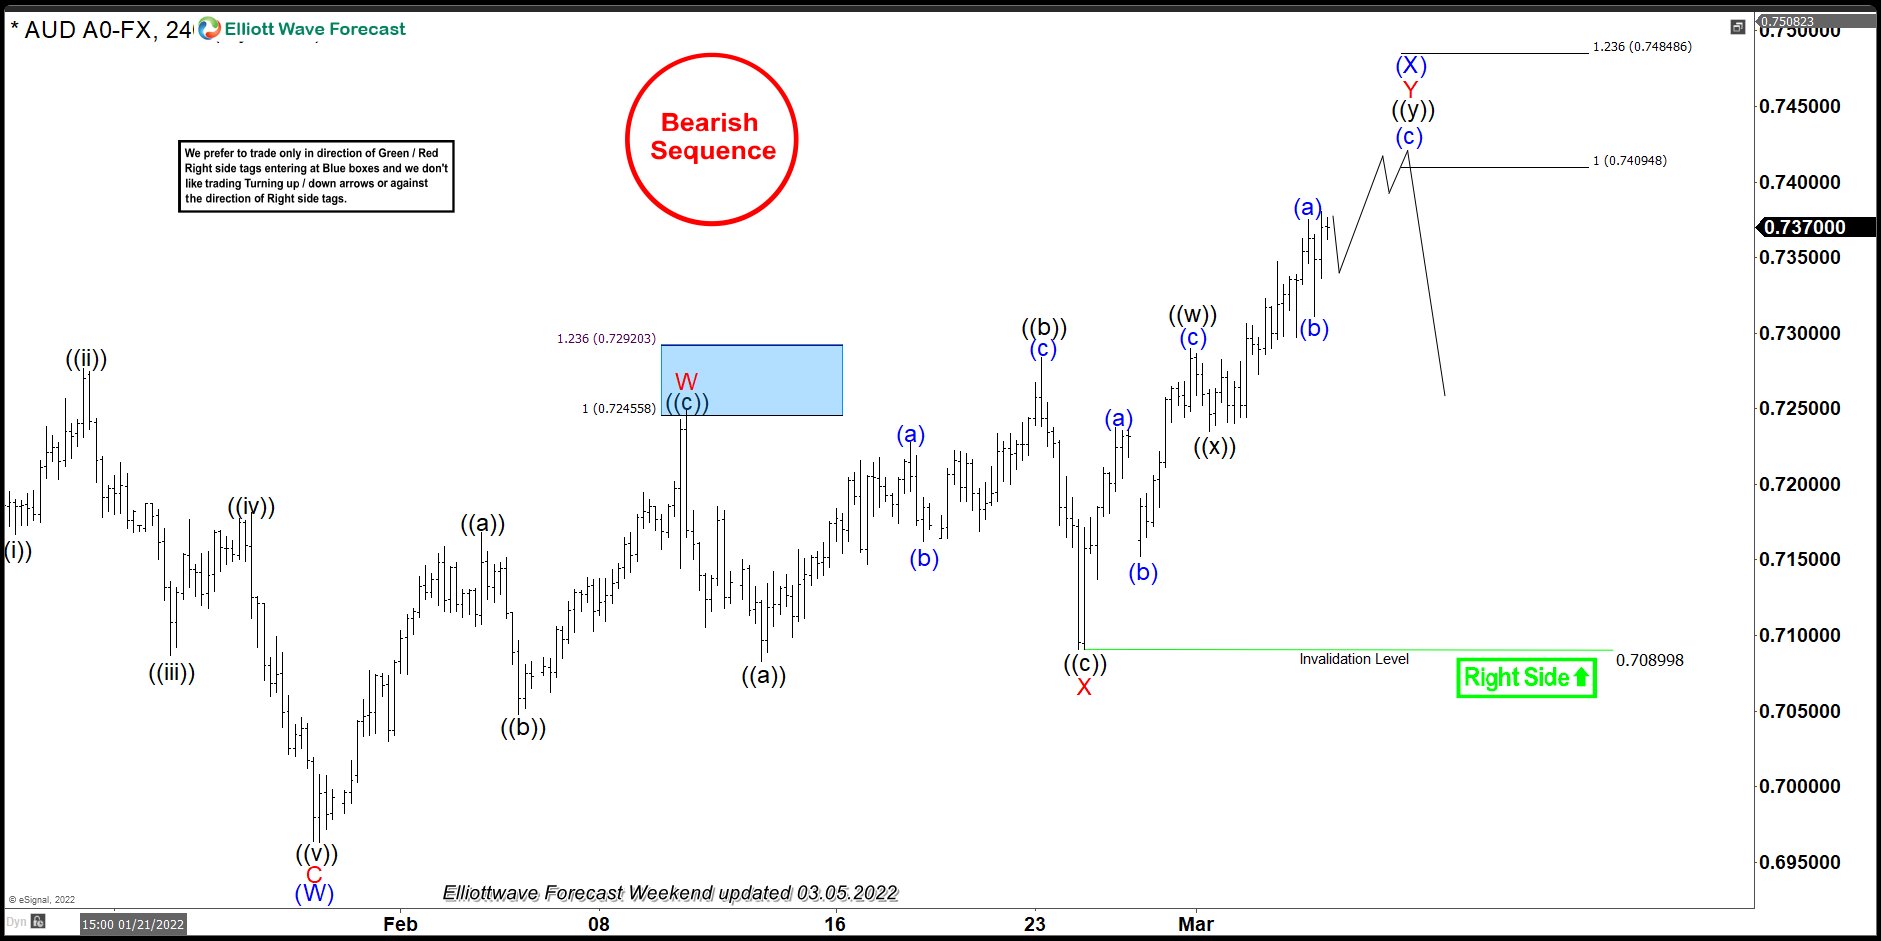
Here’s the 4 Hour Elliott wave chart from the 3/05/2022 weekend update. In which the decline to $0.6963 low ended higher degree wave (W). Up from there, the pair bounced in wave (X) to correct the cycle from 10/28/2021 high. The internals of that bounce unfolded as a double three structure where wave W ended at $0.7248 high. Wave X ended as a flat at $0.7089 low and wave Y was expected to reach $0.7409- $$0.7484 100%-123.6% Fibonacci extension area of W-X. From there, sellers were expected to appear looking for more downside or for a 3 wave reaction lower at least.
AUDUSD 4 Hour Elliott Wave Chart
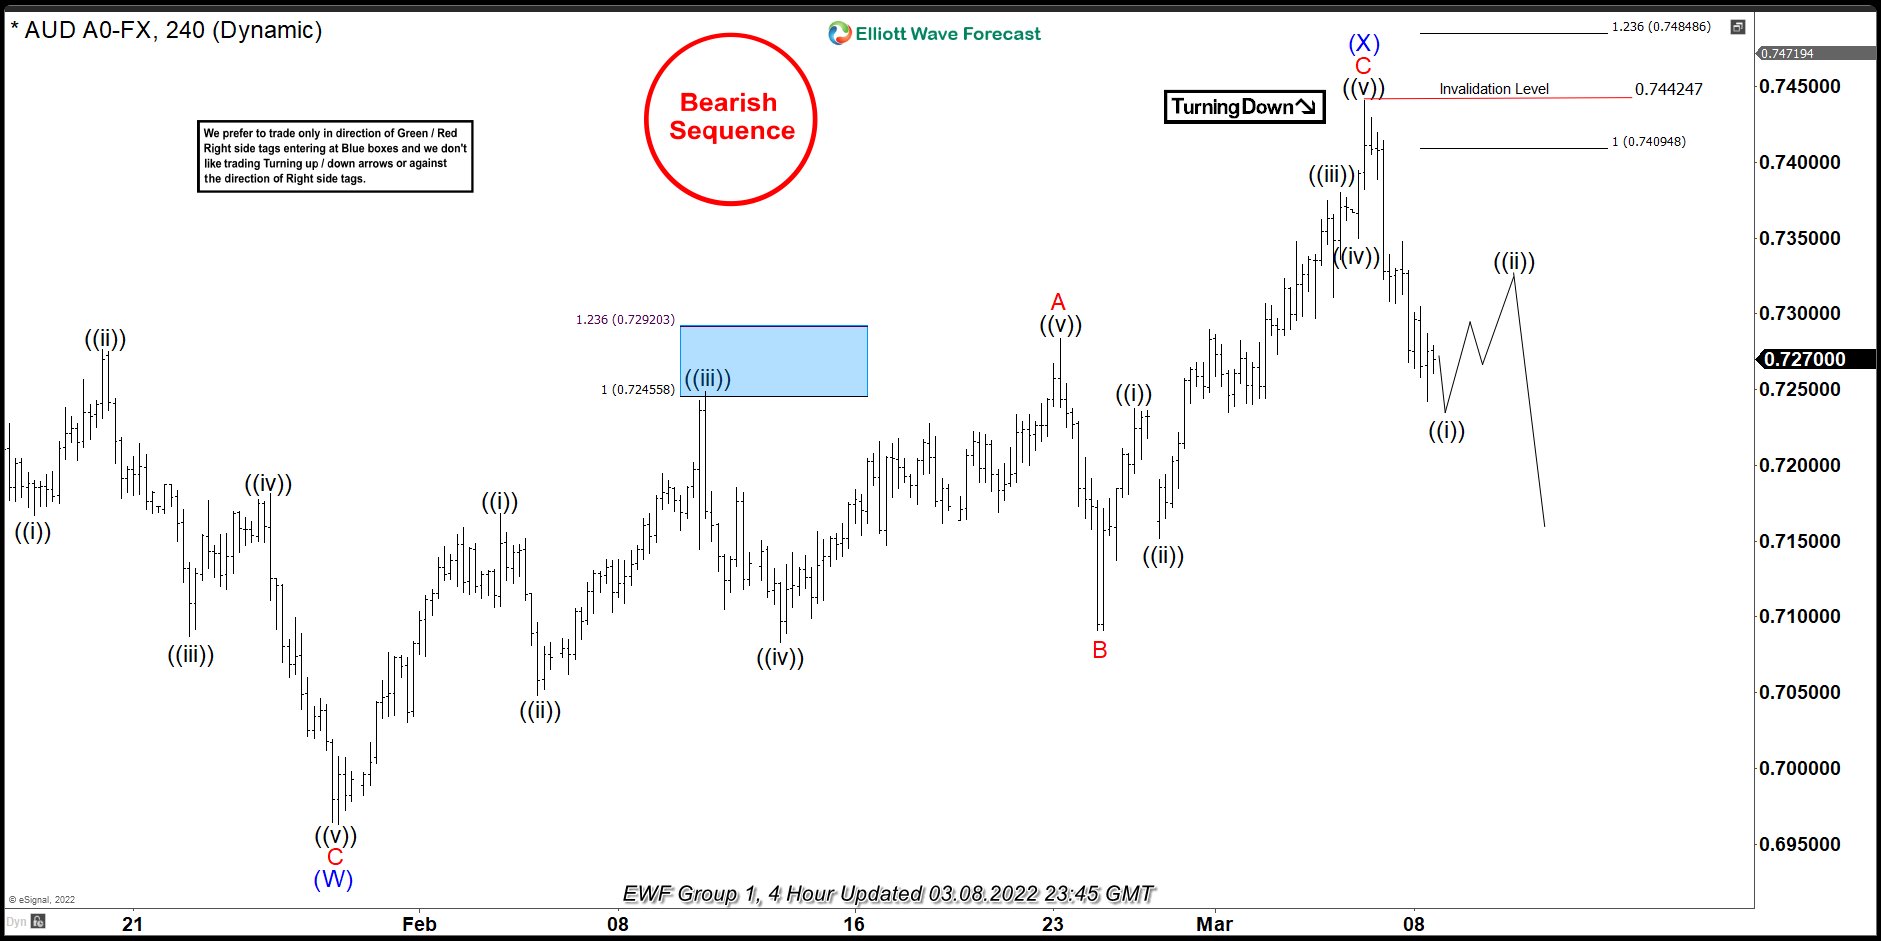
Above is the latest 4hr view from the 3/08/2022 update. In which the pair is showing reaction lower taking place as expected so far. Allowing shorts to get into a risk-free position shortly after taking the position at the equal legs area. Now as far as bounces fail below $0.7442 high then the pair is expected to resume lower. However, a break below $0.6963 level remains to be seen to confirm the next leg lower & avoid double correction higher.
Source: https://elliottwave-forecast.com/forex/audusd-reacting-lower-equal-legs/