
In this technical blog, we will look at the past performance of 1 hour Elliott Wave Charts of AUDUSD. In which, the decline from 13 January 2022 high unfolded as an impulse sequence and showed a lower low sequence. Therefore, we knew that the structure in AUDUSD is incomplete to the downside & should see more weakness. So, we advised members not to buy the pair & sell the bounces in 3, 7, or 11 swings at the blue box areas. We will explain the structure & forecast below:
AUDUSD 1 Hour Elliott Wave Chart
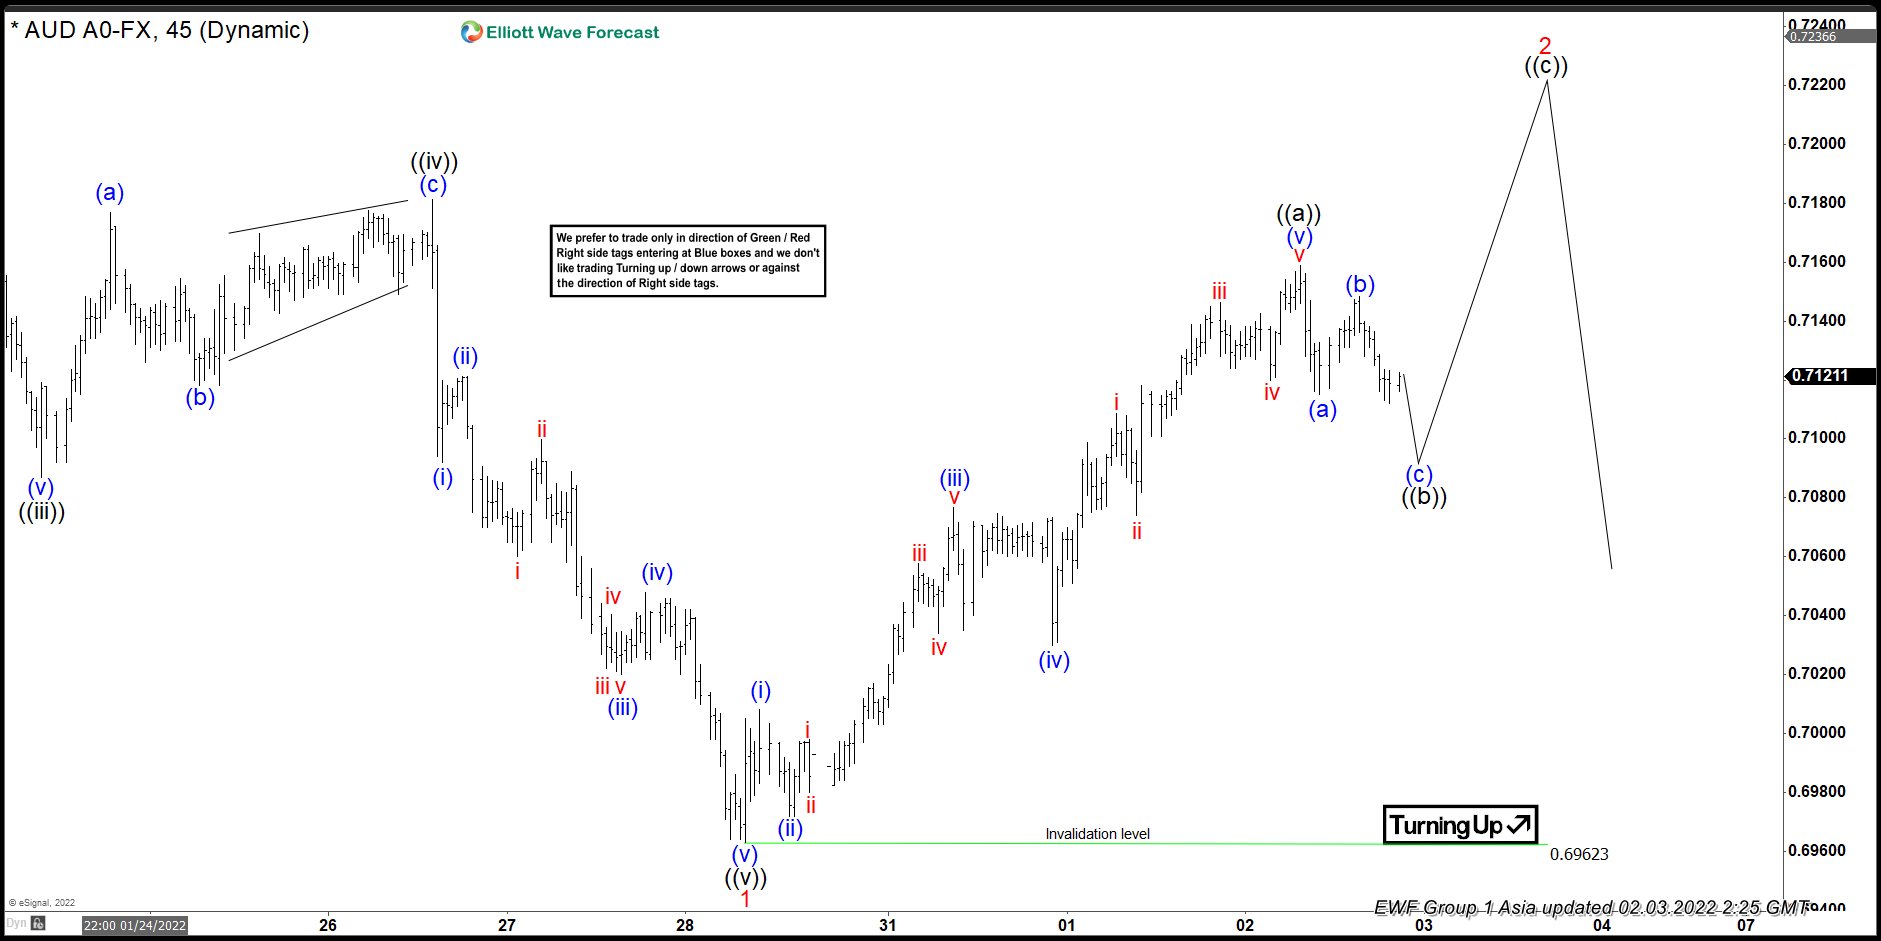
Here’s 1hr Elliott wave Chart from the 2/03/2022 Asia update. In which, the decline to $0.6963 low ended 5 waves from 1/13/2022 high in wave 1 & made a bounce in wave 2. The internals of that bounce unfolded in a lesser degree 5 wave impulse sequence, which suggested that it’s a continuation pattern & it should see another leg higher to complete the Elliott wave zigzag correction before the pair gets ready to turn lower.
AUDUSD 1 Hour Elliott Wave Chart
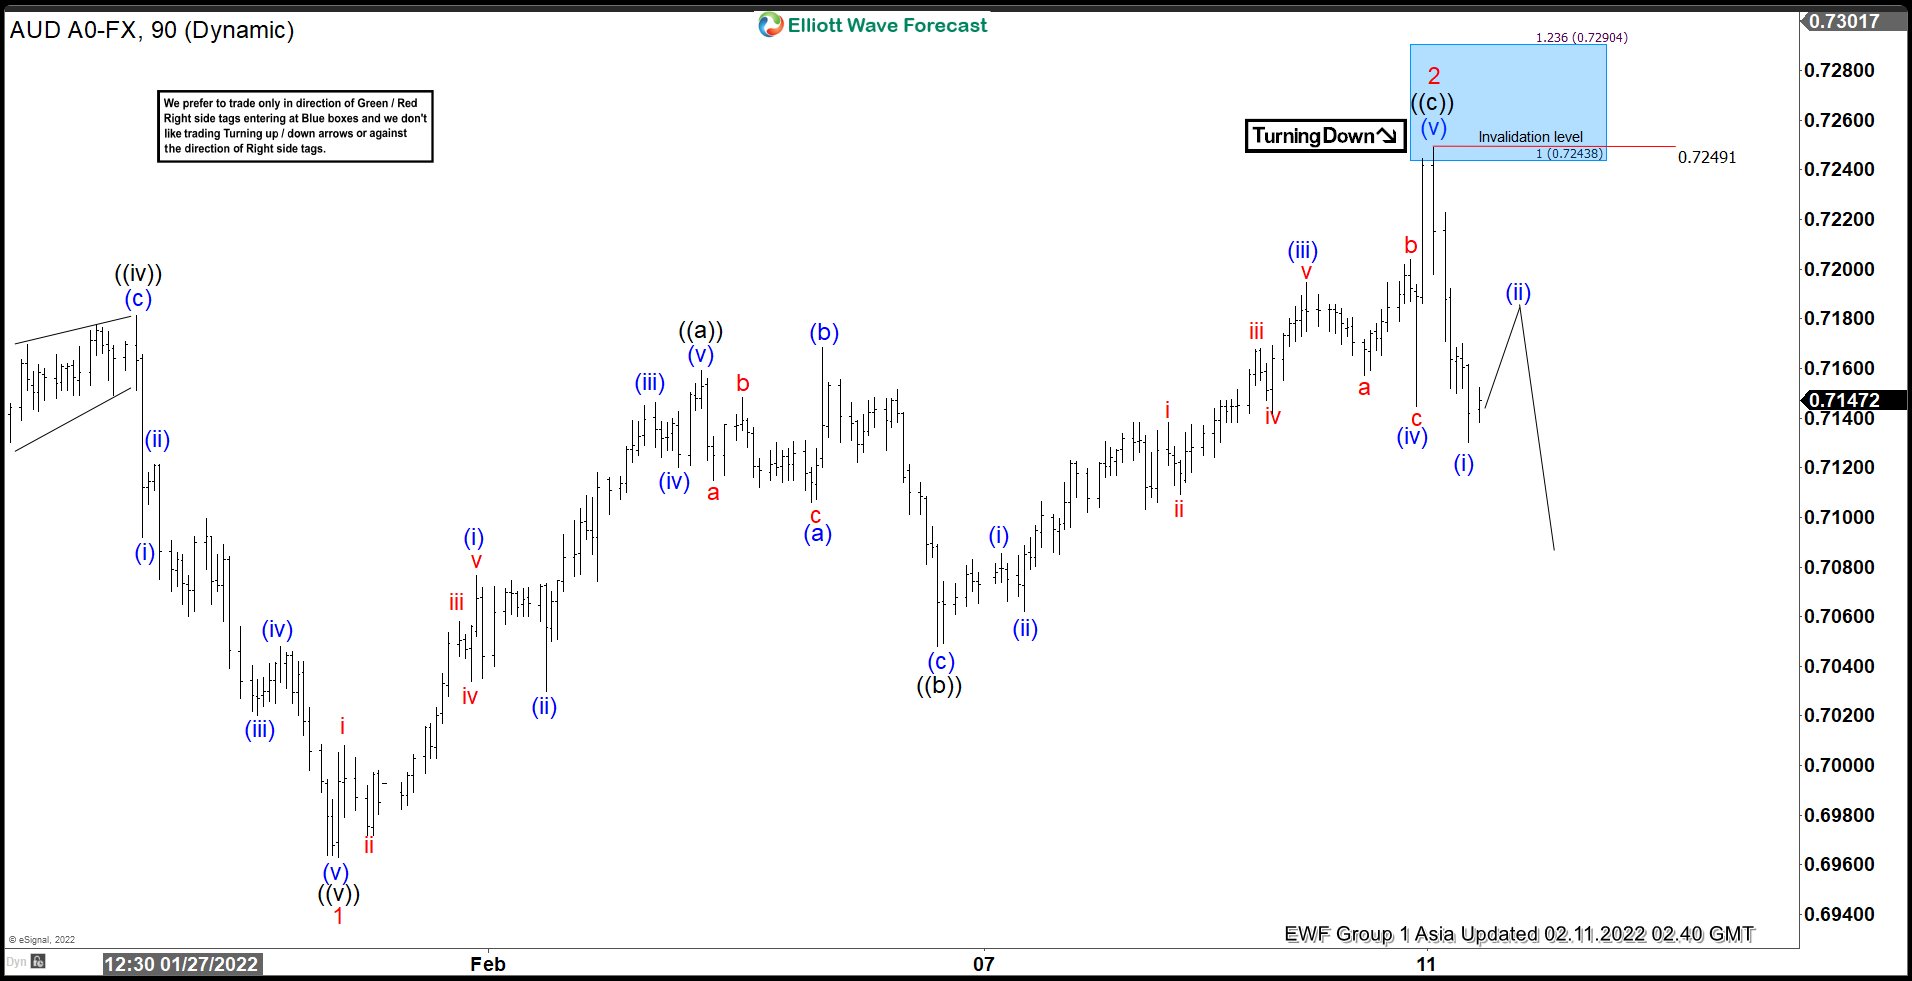
Above is the 1hr Elliott wave chart from the 2/11/2022 Asia update. In which, the pair continued the bounce higher & managed to reach the extreme $0.7243- $0.7290 blue box area. From there, the pair got rejected & found sellers as expected. Since then the pair has made a good reaction lower & already retraced more than 50% of the whole bounce allowing members to create a risk-free position shortly after taking the longs.
AUDUSD Latest 1 Hour Elliott Wave Chart

This is the latest 1hr view from the 2/17/2022 Asia update. In which the pair is showing reaction lower taking place as expected so far. Now as far as bounces fail below $0.7248 high then the pair is expected to resume lower. However, a break below $0.6963 level remains to be seen to confirm the next leg lower & avoid double correction higher.
Source: https://elliottwave-forecast.com/forex/audusd-selling-bounce-extreme-area/