
In this technical blog we’re going to take a quick look at the Elliott Wave charts of NZDUSD. The pair has reached extremes in the cycle from the February 2021 peak. However cycle from the October 21st 2021 peak still shows incomplete sequences. Besides that, AUDUSD and USDCAD still have not reached their extremes in equivalent cycles, which suggested potential extension down in NZDUSD. As our members know, NZDUSD has given us nice selling opportunity recently. The pair has made 3 waves bounce against the 0.6892 peak. We recommended members to avoid buying and keep selling rallies in 3,7,11 swings. In the further text we are going to explain the Elliott Wave Pattern and the Forecast.
NZDUSD H4 Elliott Wave Analysis 02.09.2022
NZDUSD is correcting the cycle from the 0.6892 peak. Recovery shows higher high- incomplete sequences at the moment. Consequently we are calling for more short term strength toward 0.67224-0.6806 area to complete 2 red as potential Elliott Wave Zig Zag pattern. We recommended members to avoid buying the pair in proposed push up. Strategy is waiting for Blue Box to be reached before selling the pair again. As the main trend is bearish we expect sellers to appear at the blue box for 3 waves pull back at least. Once pull back reaches 50 Fibs against the ((b)) black low, we will make short position risk free ( put SL at BE). Invalidation for the trade would be break above 1.618 fibs extension: 0.6806
As our members know Blue Boxes are no enemy areas , giving us 85% chance to get a pull back.
You can learn more about Zig Zag Elliott Wave Patterns at our Free Elliott Wave Educational Web Page.

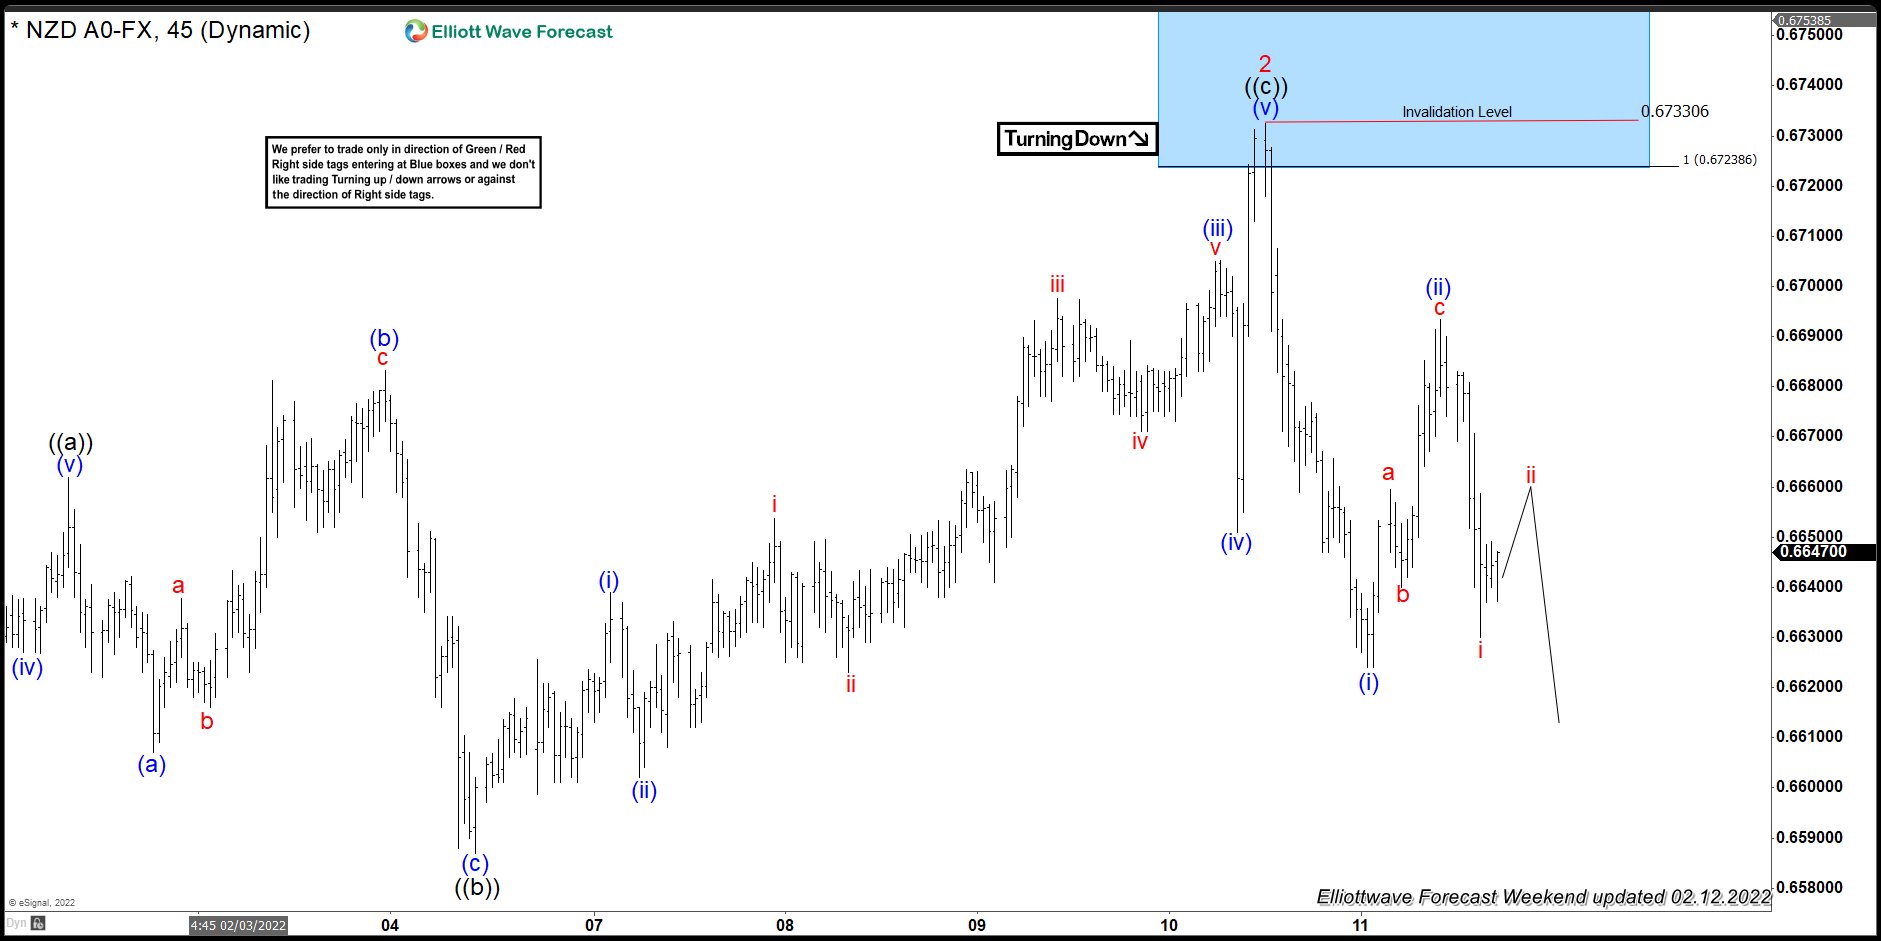
Now let’s take a look at H1 charts, to see what the price structure looks like in shorter time frames.
NZDUSD H1 Elliott Wave Analysis 02.12.2022
The pair reached equal legs area at 0.67224-0.6806 ( blue box) and made turn lower from there. At this stage we are calling recovery completed at 0.6733 high. Short term cycle from the mentioned peak ended as 5 waves decline- (i) blue. Then, we got 3 waves bounce in (ii) blue. Now we would like to see break of (i) blue low, to confirm further extension down and more separations from the latest high. The decline has already reached 50 fibs against the ((b)) black connector, so all short positions from the blue box are risk free. (SL put at BE)
NZDUSD H1 Elliott Wave Analysis 02.14.2022
Eventually NZDUSD made further extension down and broke (i) blue low. While (ii) blue peak holds, xext short term tech zone to the downside comes at 0.6586-0.6521. We would like to see break of 01/28 low to confirm next leg down is in progress.
Keep in mind market is dynamic and presented view could have changed in the mean time. You can check most recent charts in the membership area of the site. Best instruments to trade are those having incomplete bullish or bearish swings sequences.We put them in Sequence Report and best among them are shown in the Live Trading Room.

Elliott Wave Forecast
Source: https://elliottwave-forecast.com/trading/nzdusd-elliott-wave-selling-the-rallies-at-the-blue-box/