
In our article at the end of last month, we warned that Silver Miners ETF (SIL) has already reached support area. Thus the ETF is ready to turn higher anytime and rally at least in 3 waves. Now 1 month later, the ETF did turn higher from the blue box and it’s still in the early stage of a new multi-year bullish move. Let’s take a look at the Elliott Wave update below:
SIL Monthly Elliott Wave Chart
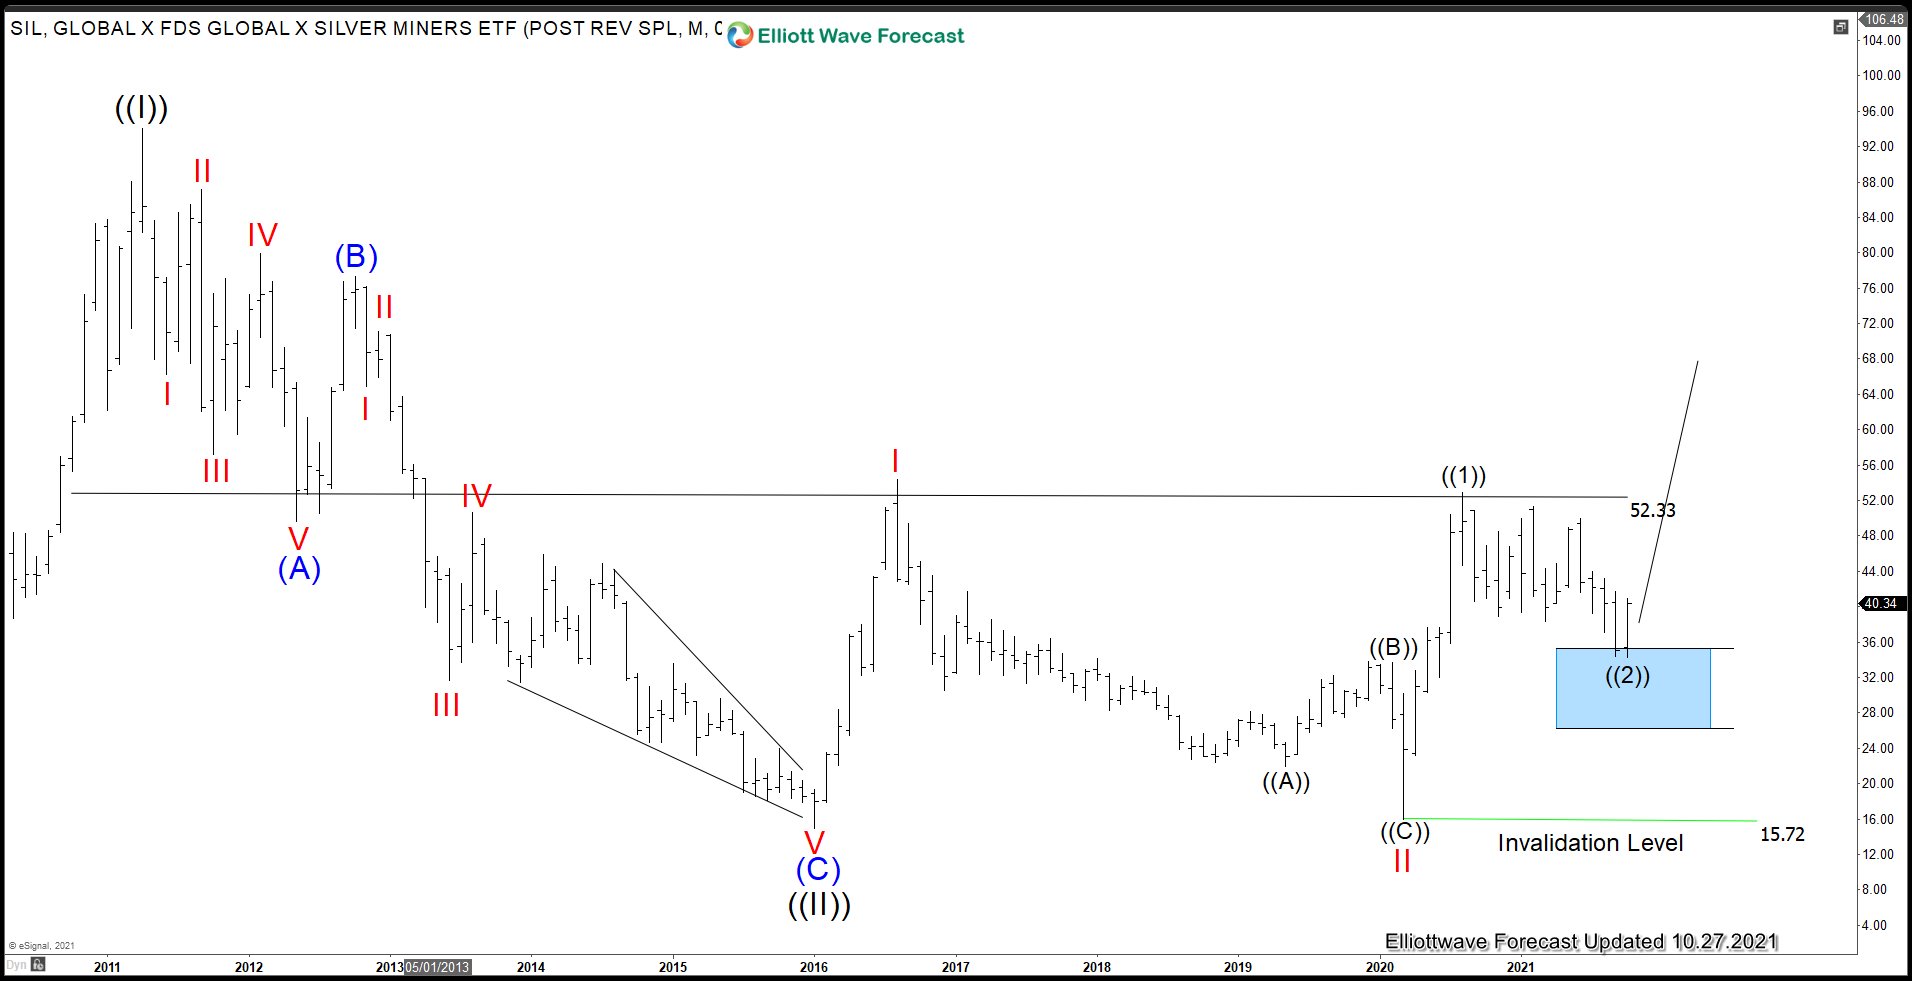
The Monthly Chart above shows that SIL is possibly forming a massive multi-year rounded bottom with the neckline around $2.3. Since bottoming in March 2020 during the Covid-19 selloff, it has retested the neckline and we labelled the current move higher from 2016 low as a nesting impulse I-II-((1))-((2)). The ETF has reached support area blue box and now turning higher. We will show it in the daily chart below how we measure the blue box area. But for now, it looks like the ETF has started to turn higher and still in the early stage of the move to the upside.
SIL Daily Elliott Wave Chart
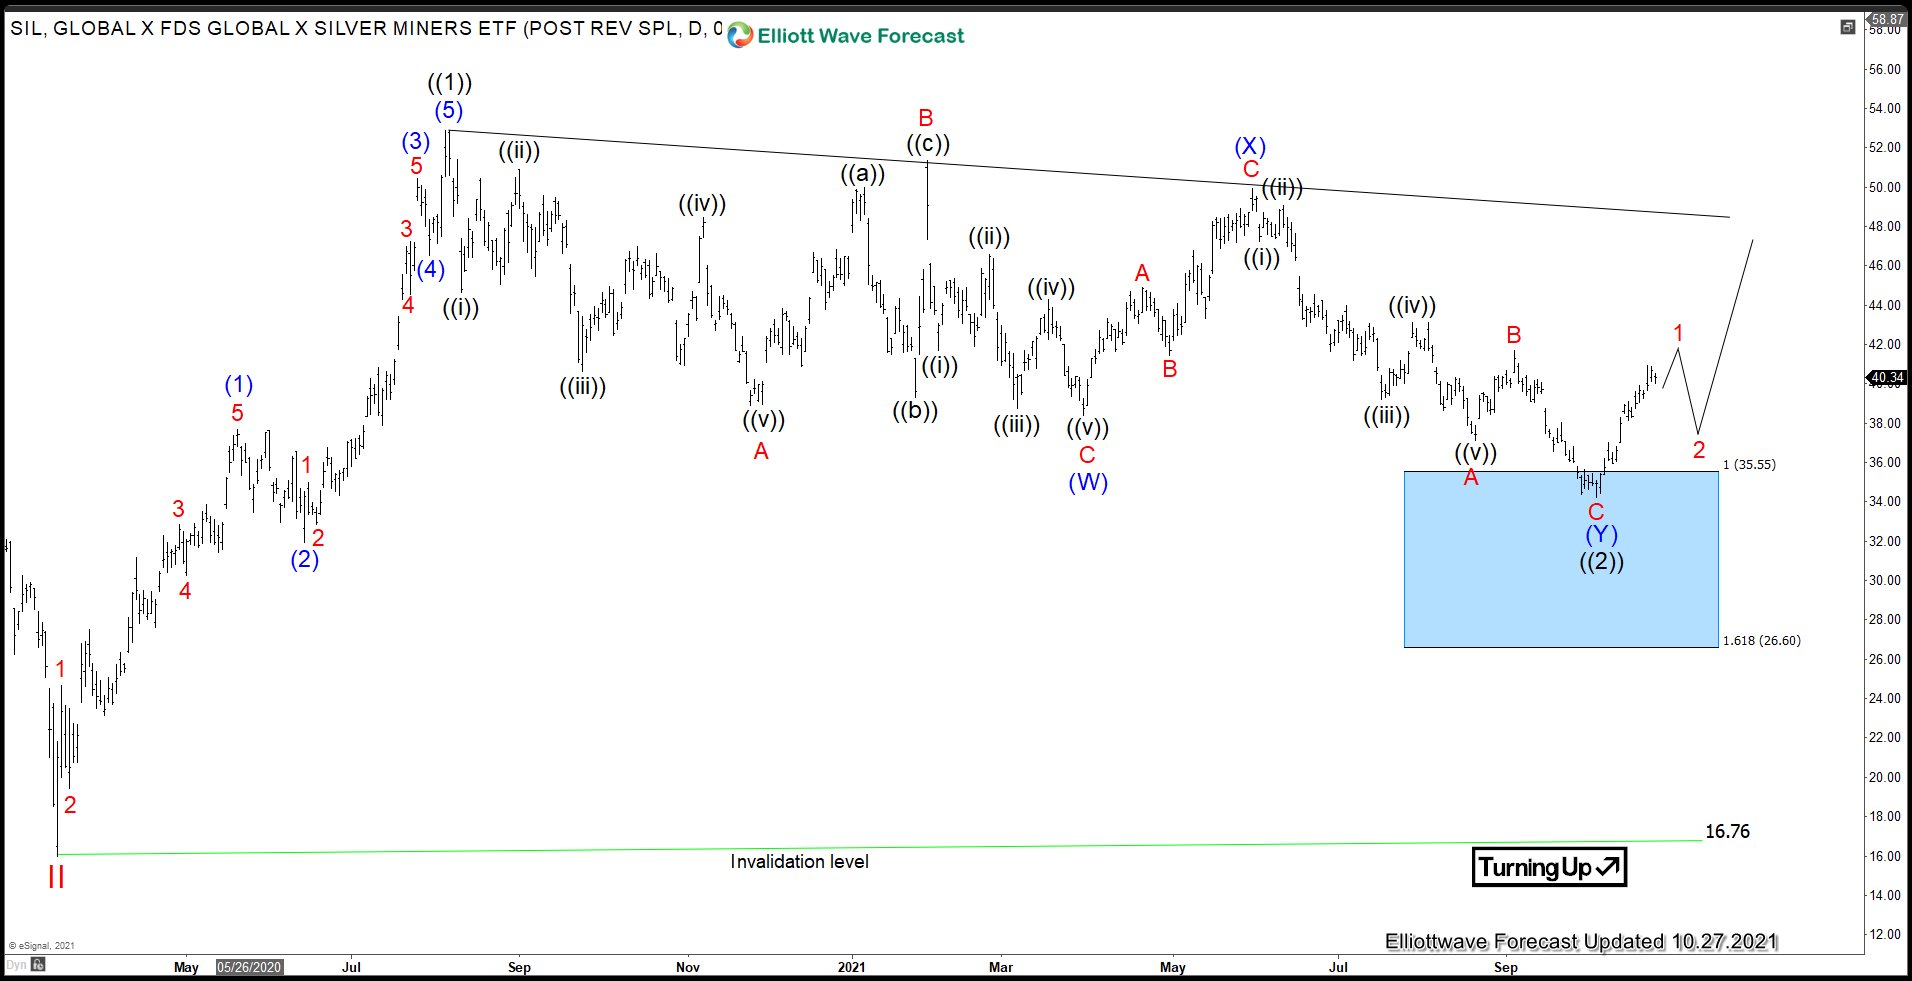
In Daily chart above, we can see the Silver Miners ETF wave ((2)) pullback reached the blue box support. This blue box is the 100% – 161.8% Fibonacci extension measured from wave ((1)) peak. The ETF turns higher from the blue box nicely and wave ((2)) is proposed complete at $34.44. Now while pullback stays above there, and more importantly above 16.76, expect the ETF to continue higher.
Source: https://elliottwave-forecast.com/stock-market/silver-miners-etf-sil-ended-correction/