
Cotton is one of soft commodities, along with sugar, coffee, orange juice and cocoa. In early centuries, Alexander the Great has brought cotton from Pakistan to Europe. Much later and finally, it has obtained the dominance in textile manufacturing during the British industrial revolution in the 18th century. It was so critical that at times of Civil War in North America the Confederate bonds sold in Europe were backed by cotton. Today, the largest producers and, at the same time, the largest consumers of cotton are China and India. One can trade Cotton futures at ICE owned New York Board of Trade in contracts of 50’000 pounds each under the ticker CT #F. Also, there are similar contracts at CME owned NYMEX under the ticker TT #F.
Currently, we see other soft commodities like coffee and sugar turning higher after a long period of depressed prices. Based on the correlation within group of softs, the cotton is expected to turn higher as well. In particular, wave structure of CT #F supports that bullish view. Will the rally in the cotton prices make buying of the new clothes less affordable for the broad population?
Cotton Quarterly Elliott Wave Analysis 05.08.2021
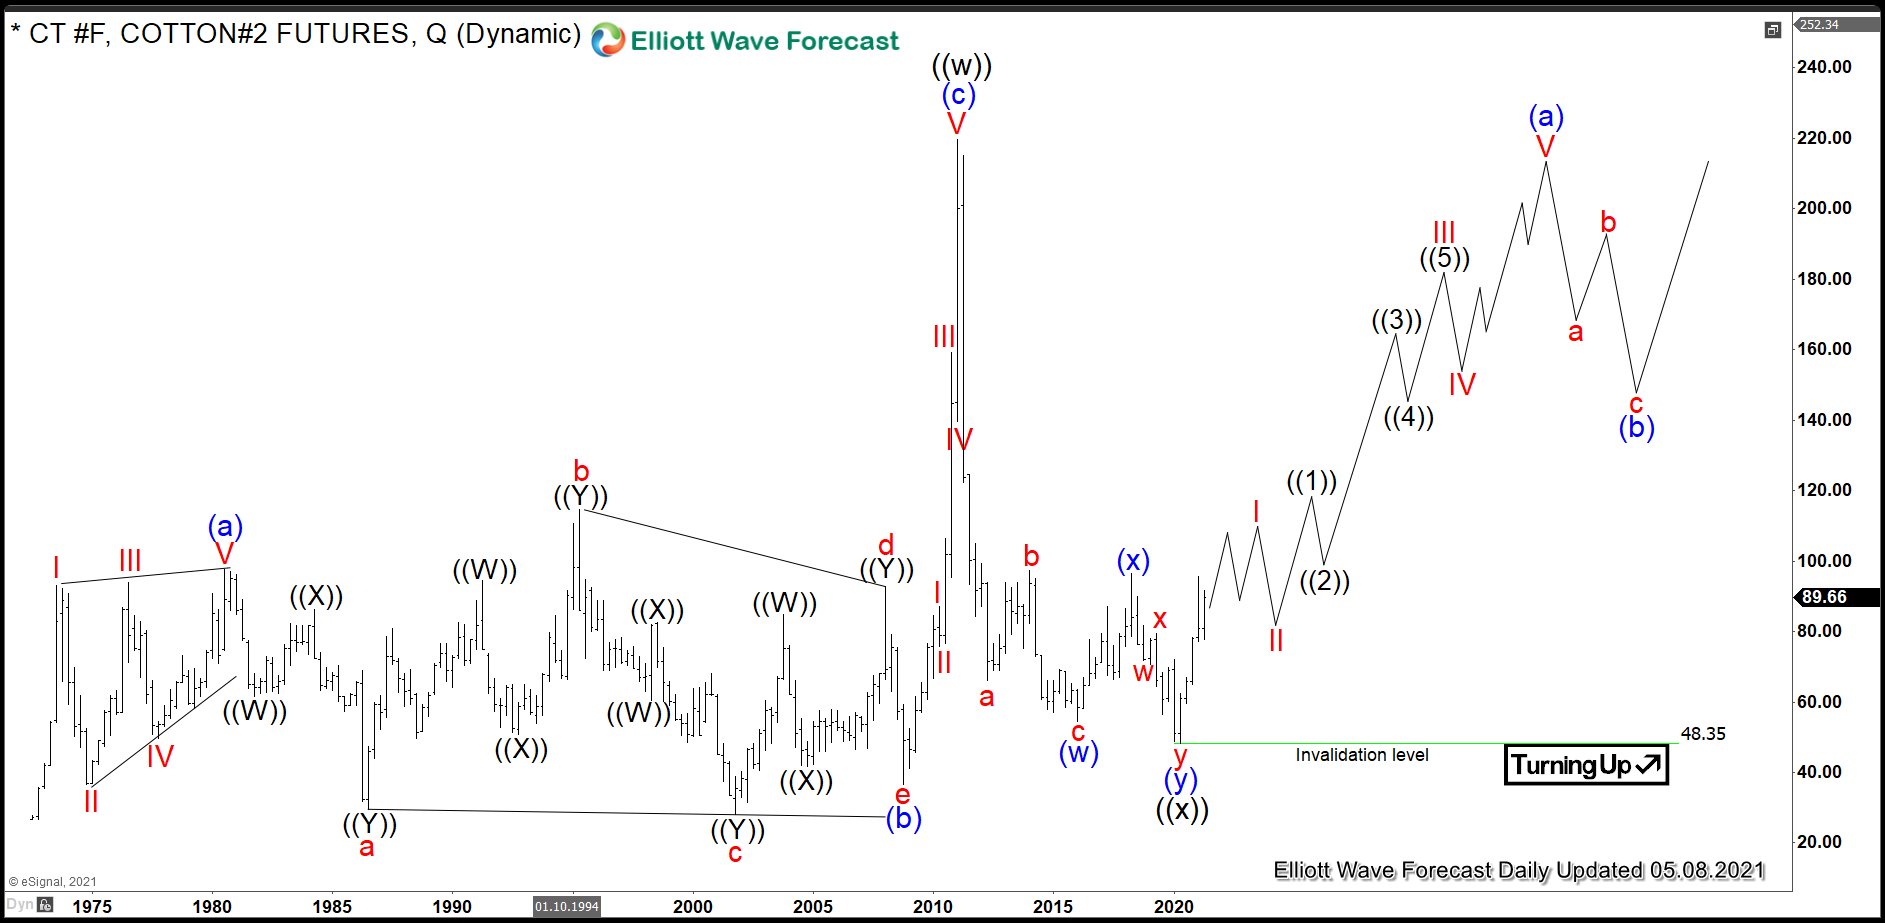
The quarterly chart below shows the cotton front contract CT #F at NYBOT. Historically, cotton has been traded at New York Cotton Exchange since 1870. Later, it moved to NYBOT and the chart data shows cotton prices from 1972 on. From the lows, the prices have developed a corrective cycle higher in black wave ((w)) of a grand super cycle degree. One can see it as an Elliott Wave zigzag pattern. Hereby, blue wave (a) has demonstrated a leading diagonal structure and has ended in 3rd quarter of 1980. From there, a running triangle in wave (b) has caught the market in range bound oscillations until the 4th quarter of 2008. From there, the sideways market has resolved into an acceleration higher within an impulsive move in wave (c). Hereby, cotton has made 6x in prrice and saw the all-time highs in the 1st quarter of 2011 at 219.70.
From the all-time highs in 2011, a correction lower in wave ((x)) has unfolded as an Elliott Wave double three pattern. In 9 years, CT #F has become cheaper by 78% reaching 48.35 level. It is the preferred view that an important bottom on April 2020 has been set and the correction has ended. From the lows, a new multi-decade cycle within black wave ((y)) may have started.
For 2021-2040, the expectations are to retest if not to break above the all-time highs. The target for wave ((y)) will be 268-404 area. From current levels, the cotton can, therefore, tripple in price.
Cotton Daily Elliott Wave Analysis 05.08.2021
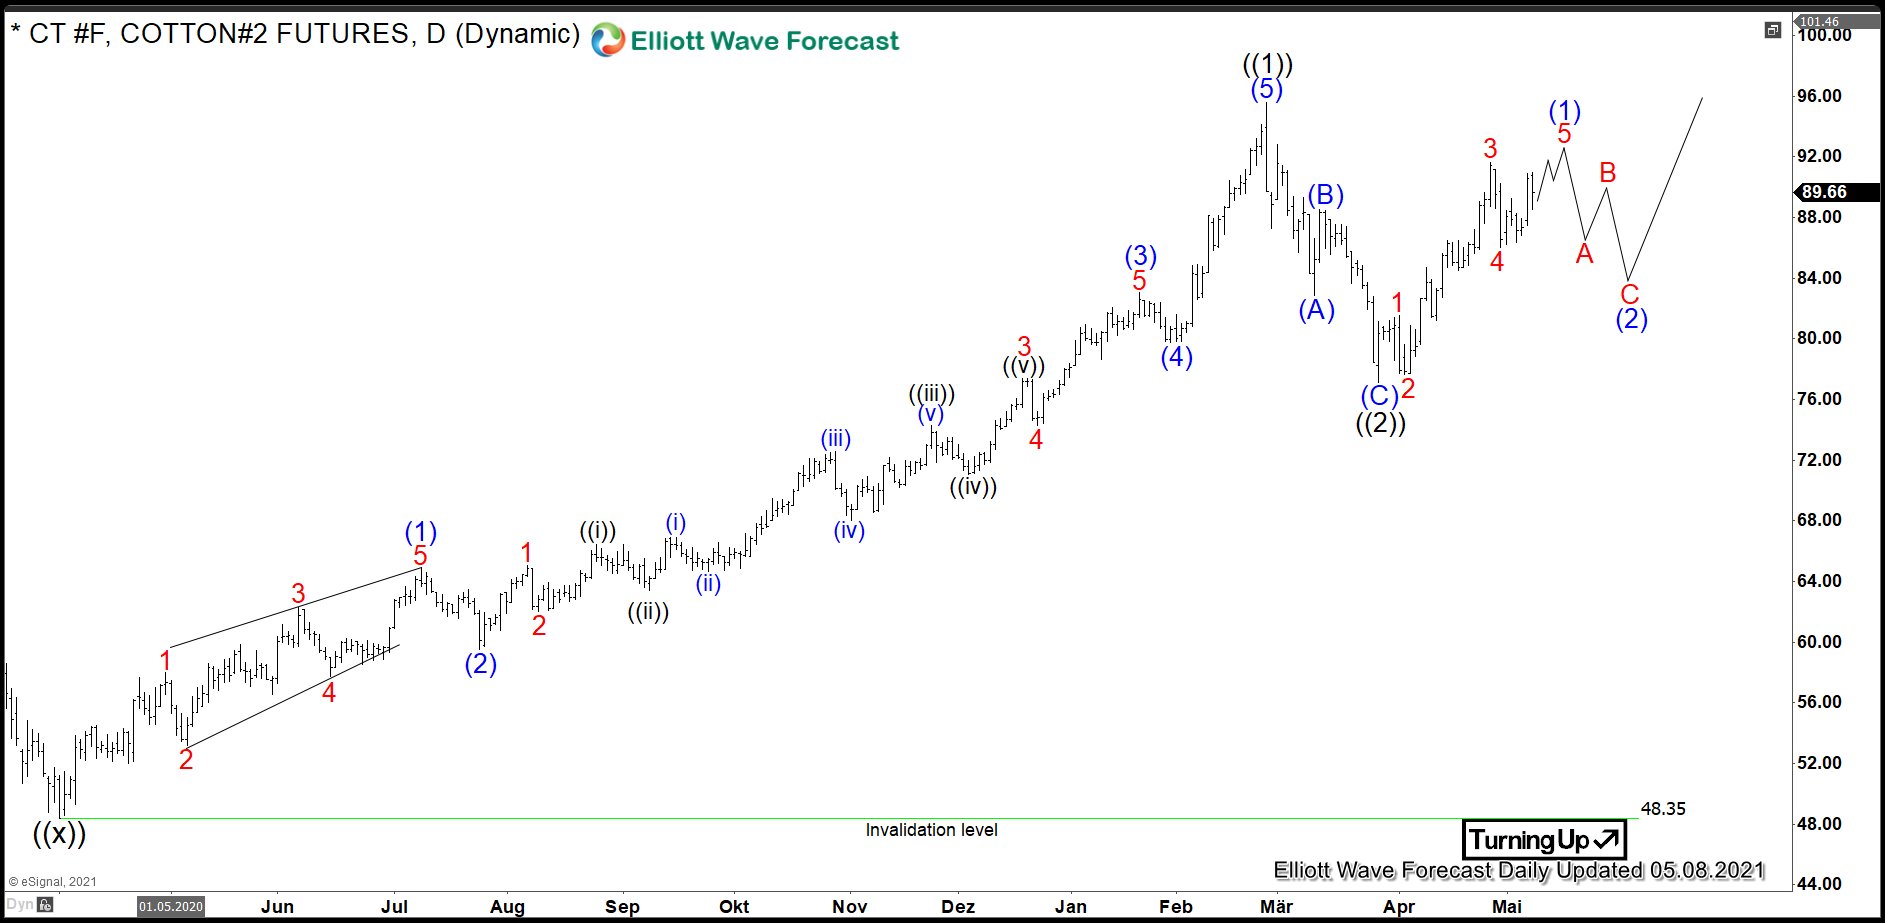
The daily chart below shows in more detail the first stages of the new cycle within grand super cycle in black wave ((w)). From April 2020 lows, a clear impulse in black wave ((1)) has ended. A pullback in wave ((2)) might have ended at 77.12 on March 26th. While above there, wave ((3)) can extend higher. Long term investors can be looking building up a long position in pullback against 48.35 lows expecting more upside.
Source: https://elliottwave-forecast.com/commodities/cotton-started-new-cycle/