
Hello fellow traders. As our members know Soybean Futures ($ZS_F) has been giving us nice trading setups recently. ( refer to blogs : $ZS_F 1.4 and $ZS_F 1.11) In this blog, we’re going to take a quick look again at the Elliott Wave charts of Soybeans ZS_F and explain trading strategy we have had recently . Soybeans Futures is showing impulsive sequences in the cycle from the April 808’0 low. We’ve been calling rally in the commodity and recommending members to keep buying the dips in 3,7,11 swings whenever chances occur .
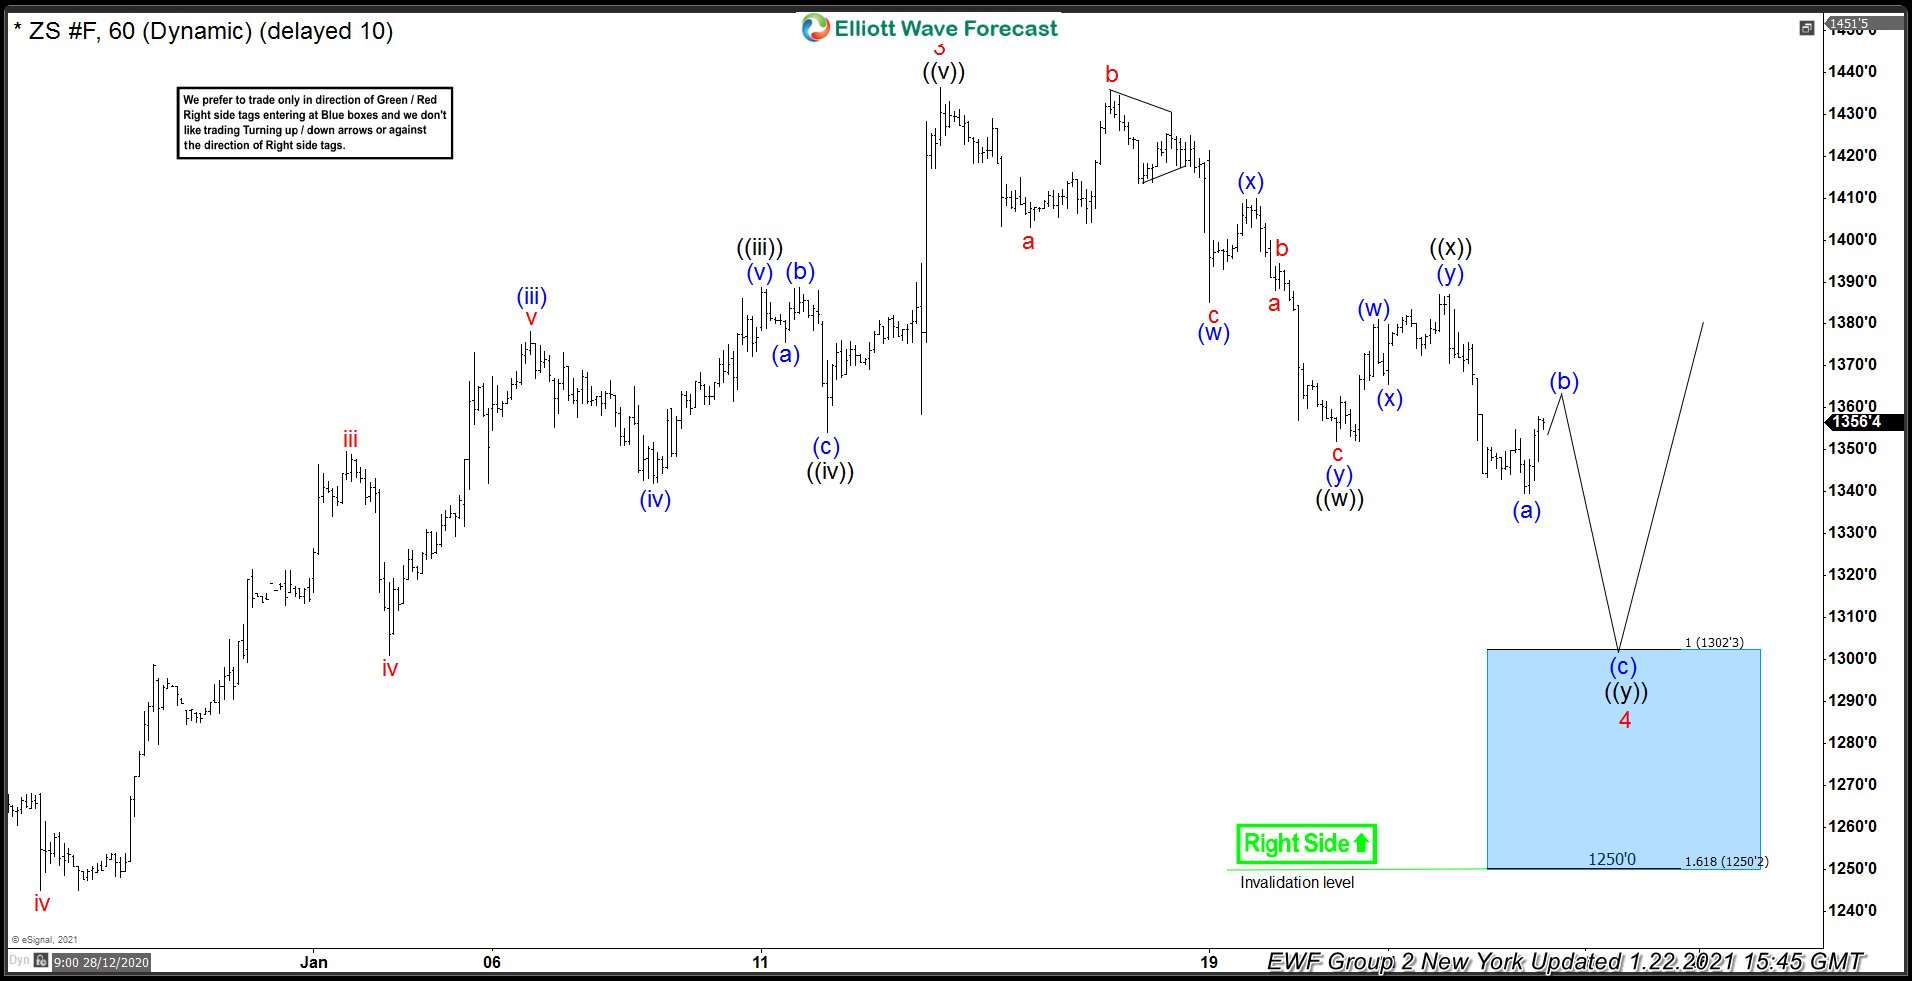
Soybeans ZS_F 1h Hour Elliott Wave Analysis 1.22.2021
The commodity is doing wave 4 red pull back. Correction is unfolding as Elliott Wave Double Three Pattern. Correction is showing incomplete sequences at the moment, suggesting another leg down potentially toward 1302’3 -1250’2 ( buying zone). We don’t like selling in any proposed leg down and favor the long side from the blue box area as far as the price stays above 1.618 fib ext 1250’2. As soon as the bounce reach 50 Fibs against the middle pivot ((x)) black we will make long positions risk free( put SL at BE)
As our members know, Blue Boxes are no enemy areas , giving us 85% chance to get a bounce. You can learn more about Elliott Wave Patterns at our Free Elliott Wave Educational Web Page.
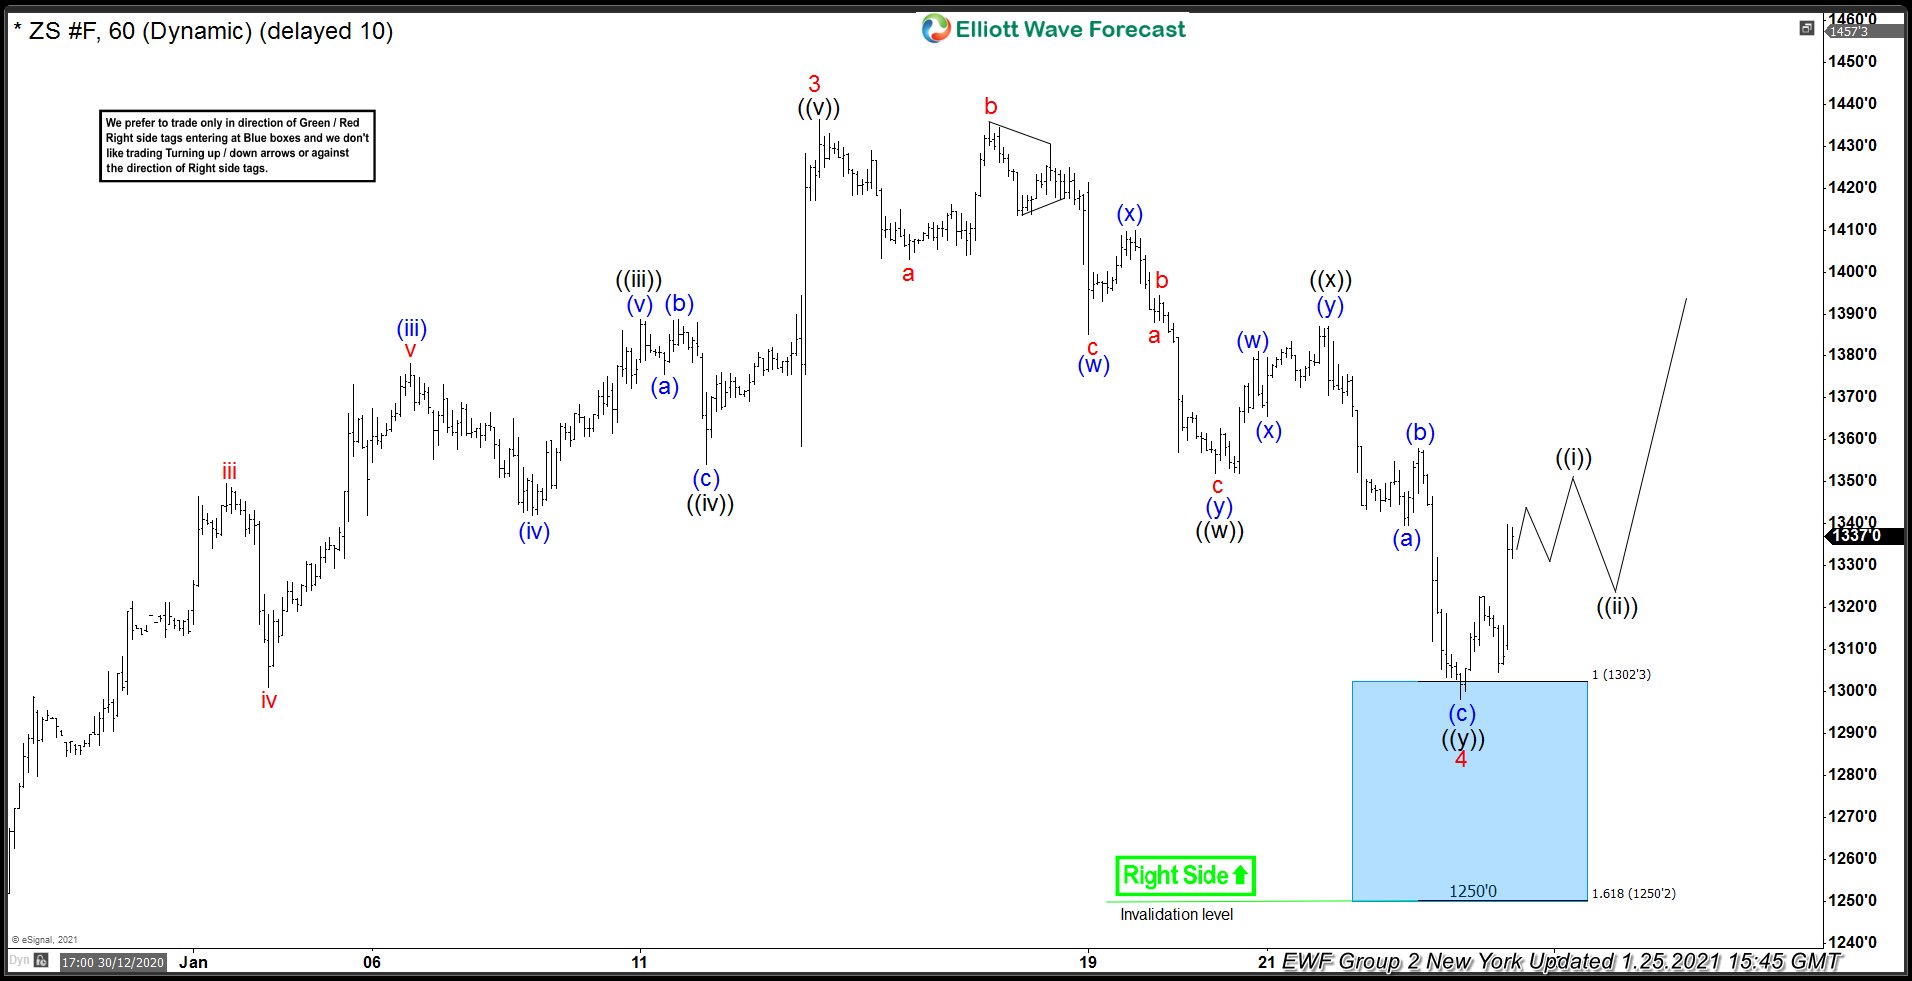
Soybeans ZS_F 1h Hour Elliott Wave Analysis 1.25.2021
Soybeans Futures made proposed extension down and reached buyers zone at 1302’3 -1250’2. At this moment we can count clear 7 swings down from the peak, when pull back 4 red ended at 1298’2 low as Elliott Wave Double Three Pattern. The commodity found buyers at blue box area as we were expecting . The bounce is close to reach 50 fibs against the ((x)) high, when we should make long positions risk free. As far as the price stays above latest 1298’2 low, we expect further rally.
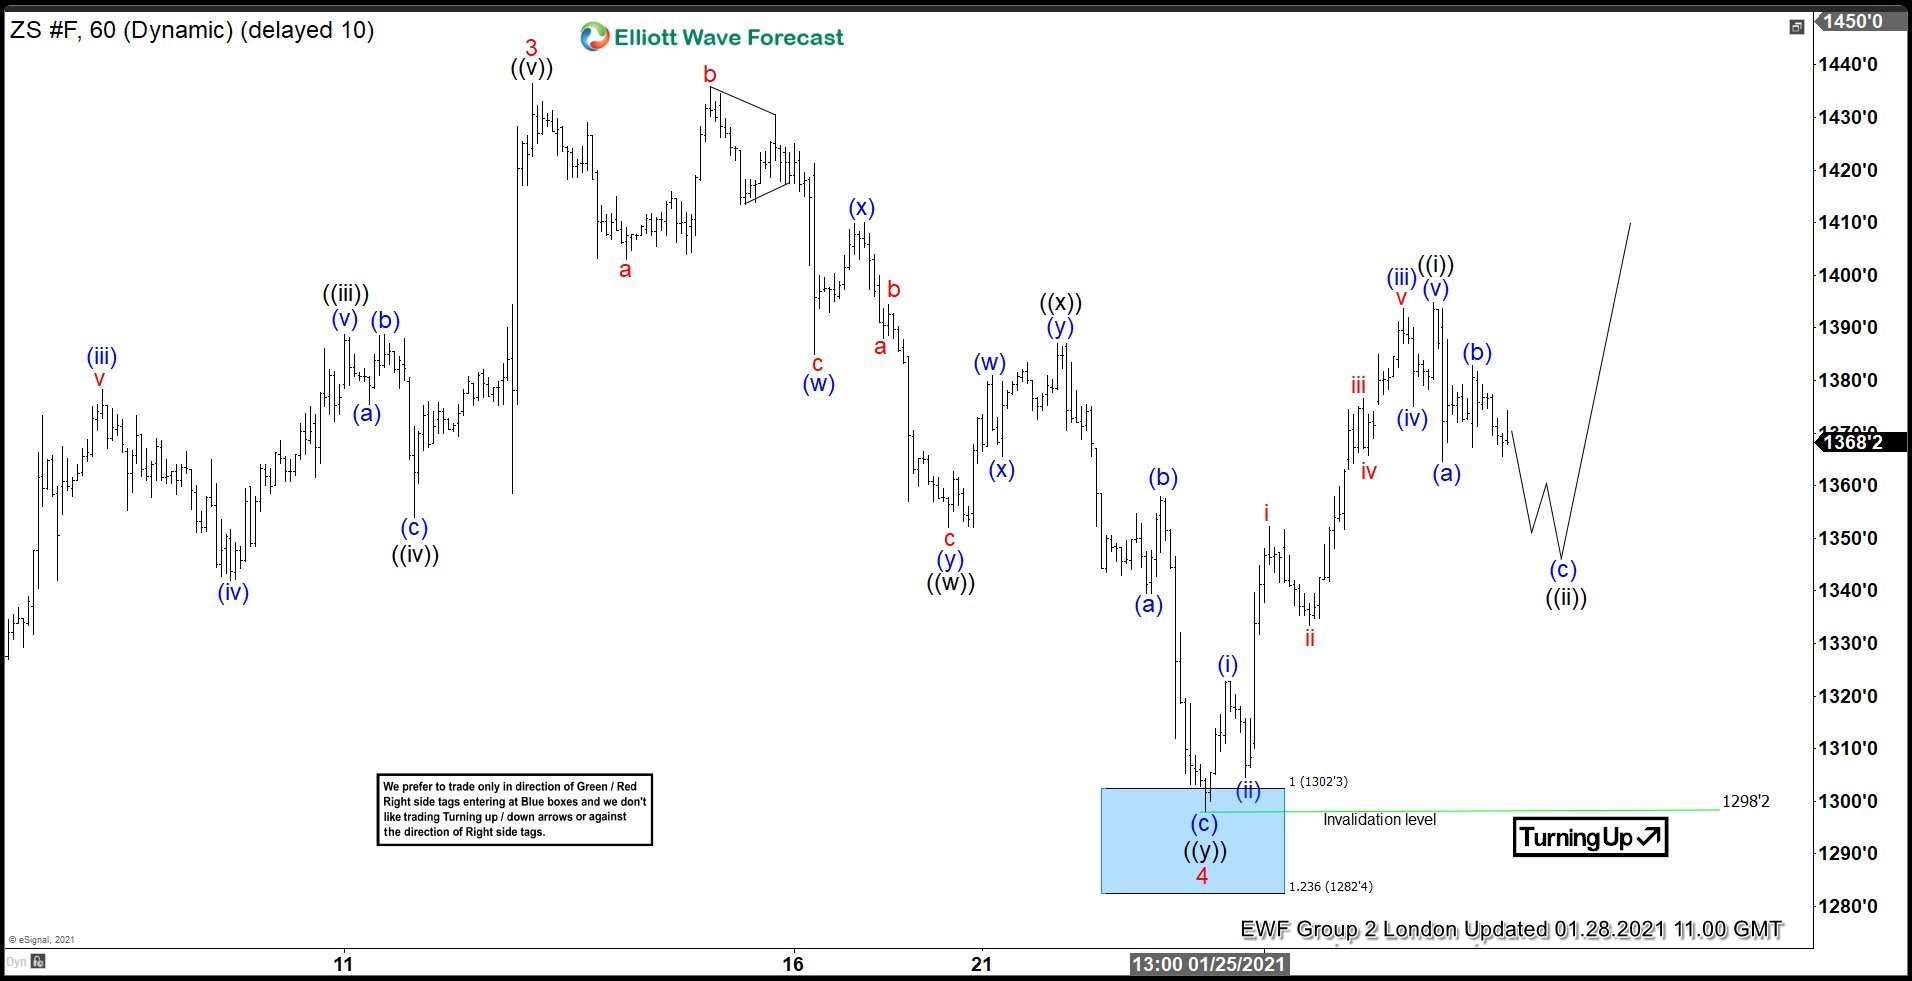
Soybeans ZS_F 1h Hour Elliott Wave Analysis 1.28.2021
1298’2 low held nicely and we got separation higher as expected. Short term cycle from the mentioned low ended as 5 waves rally ((i)) . Now Futures is doing ((ii)) pull back that can see approximately 50-61.8 fibs zone : 1346’2-1335’2. At that area we expect pull back to complete and buyers to appear for further rally ideally.
Keep in mind that market is dynamic and presented view could have changed in the mean time. Best instruments to trade are those having incomplete bullish or bearish swings sequences. We put them in Sequence Report and best among them are shown in the Live Trading Room. You can check most recent charts in the membership area of the site.
Source: https://elliottwave-forecast.com/trading/another-trading-soybeans-futures/