
In this technical blog, we are going to take a look at the past performance of the Bitcoin ticker symbol: $BTCUSD 1-Hour Elliott wave Charts that we presented to our members. In which, the Bitcoin made new all-time highs. While the rally from 21 December 2020 low showed an impulse structure with the right side up called for more upside to take place. Therefore, our members knew that buying the dips into the direction of the bullish tag remained the preferred path. We will explain the Elliott wave structure & buying opportunity our members took below:
Bitcoin 1 Hour Elliott Wave Chart
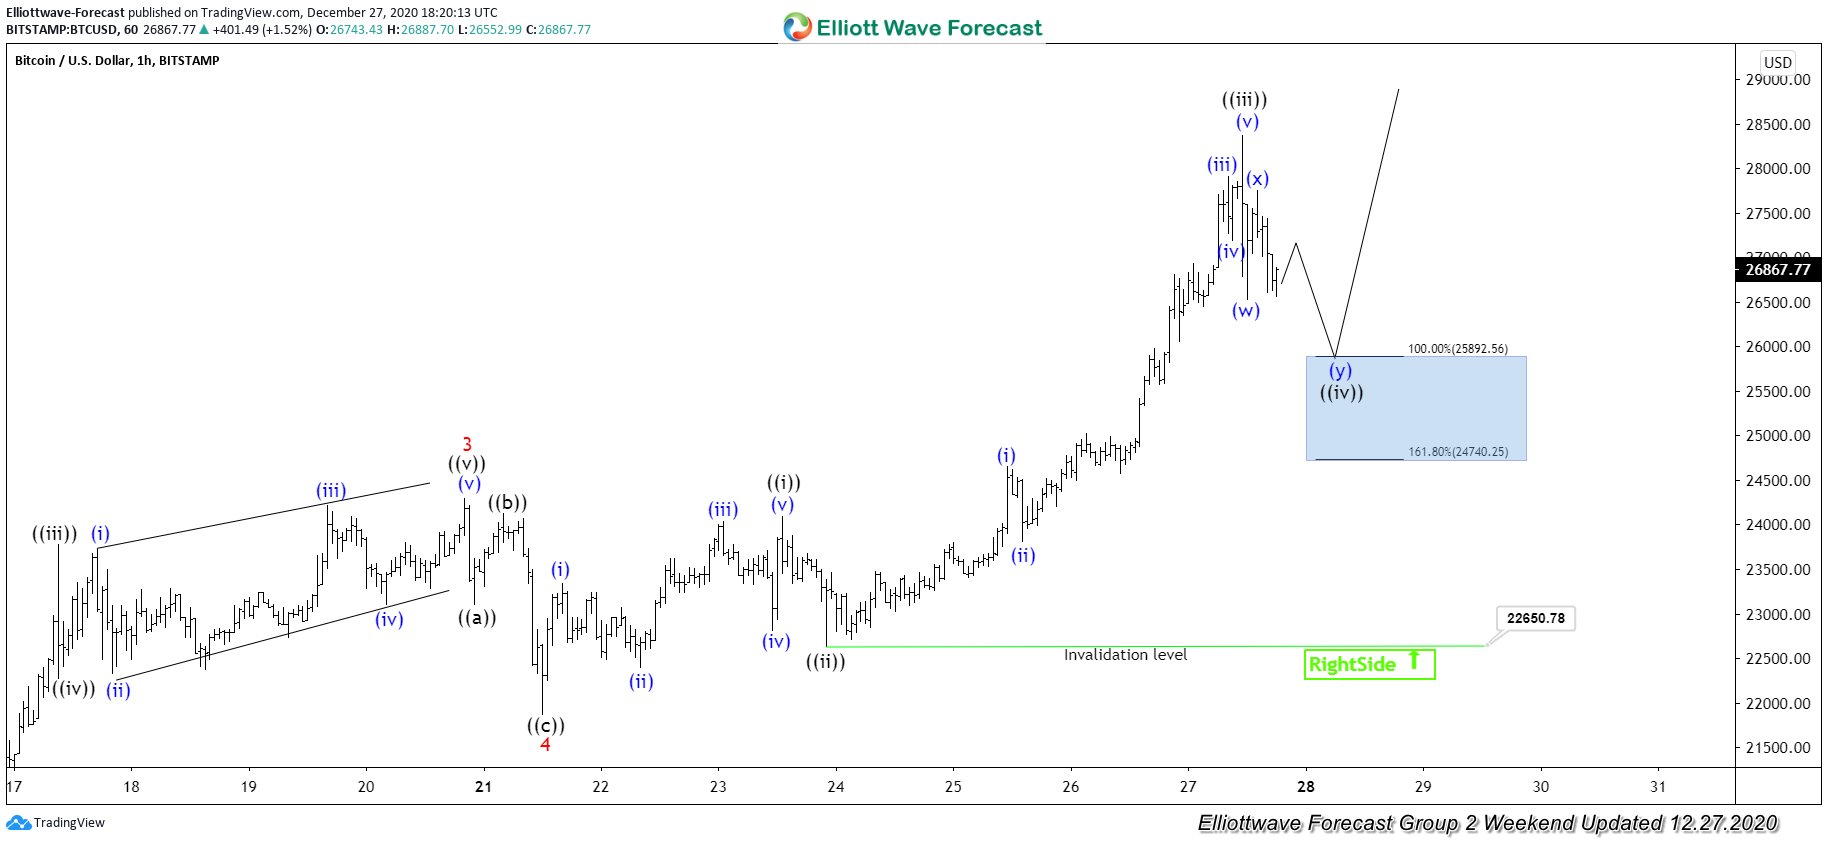
Above is the 1 Hour Elliott Wave Chart from the 12/27/2020 update. In which, the rally from 12/21/2020 low ($21864) unfolded in 3 waves structure with extended wave ((iii)). So, our members knew that the structure is incomplete & Bitcoin should do a pullback in wave ((iv)) & see another push higher in wave ((v)) to complete the 5 waves impulse sequence. Therefore, our strategy was to buy the pullback in wave ((iv)) at the blue box area at $25892- $24740 100%-161.8% Fibonacci extension area of (w)-(x). From there, the next leg higher was expected to take place looking for new all-time highs.
Bitcoin 1 Hour Elliott Wave Chart
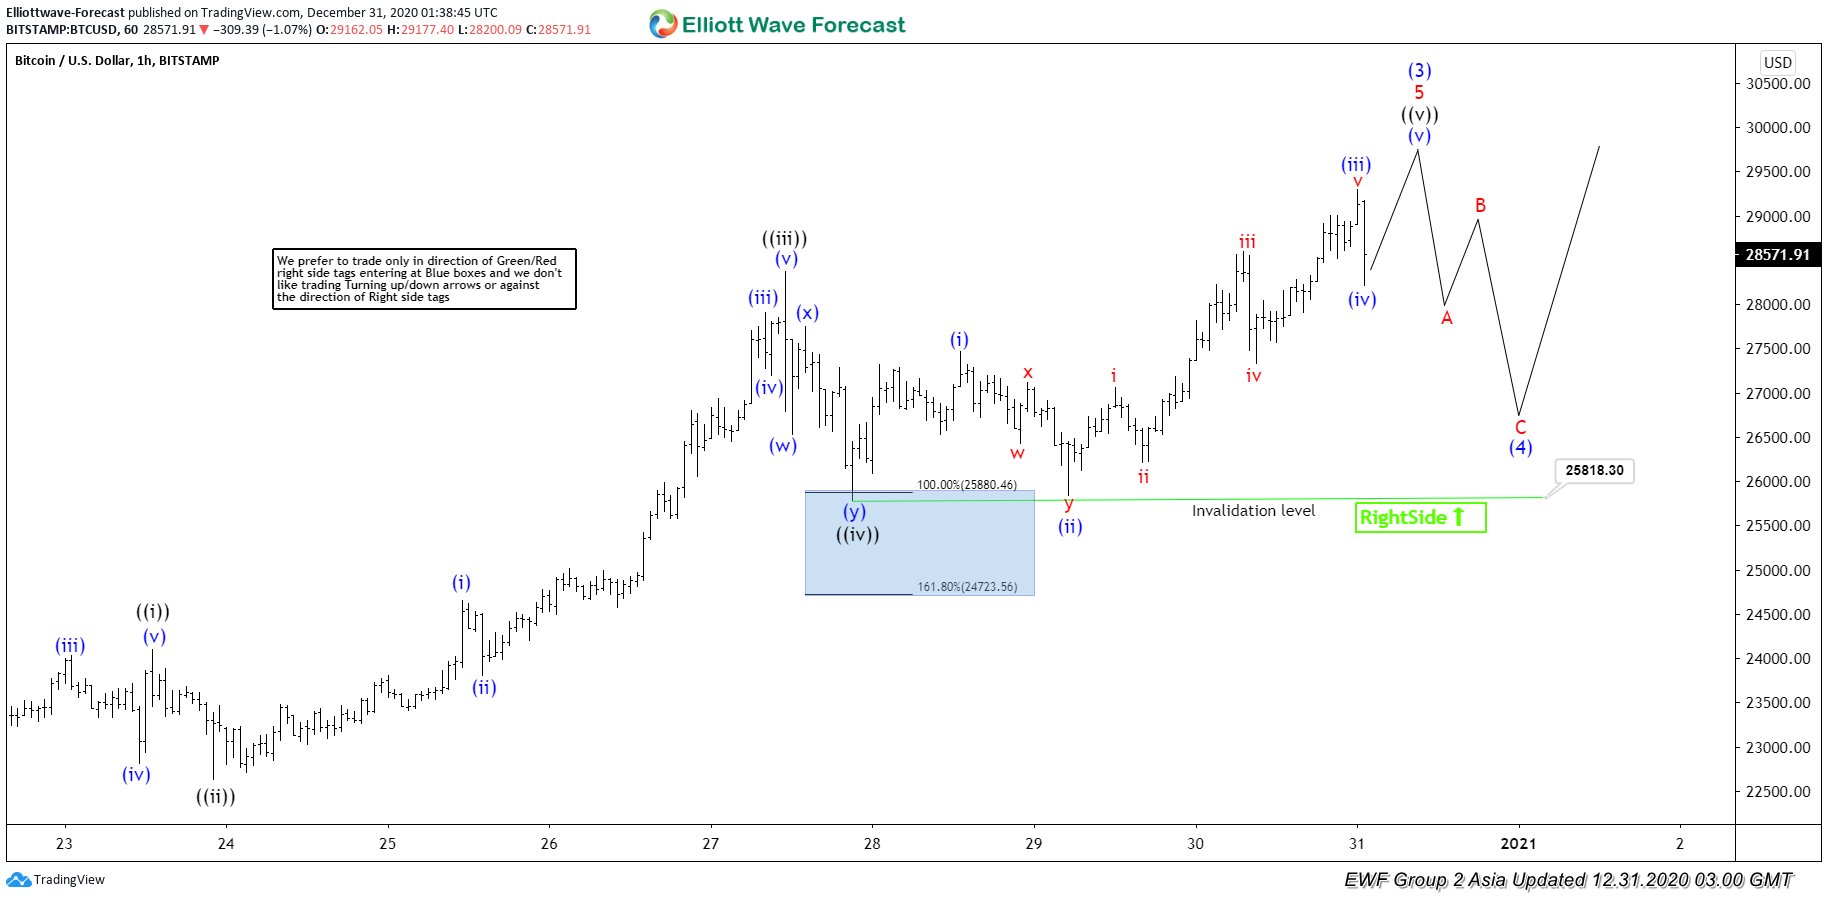
Here’s the latest 1 hour Elliott Wave Chart of Bitcoin from 12/31/2020 Asia update. In which, the Bitcoin managed to reach the blue box area at $25892- $24740 as we were expecting and provided a buying opportunity. From there, Bitcoin rallied once again & made new all-time highs.
Source: https://elliottwave-forecast.com/forex/bitcoin-made-new-highs-blue-box-area/