
Emerging Market has been lagging the US market in the past 10 years. One ETF which tracks the Emerging Market’s performance is iShares MSCI Emerging Market (EEM). The ETF gives exposure to large and mid-sized companies in emerging markets. Currently, the largest three holdings in the ETF are all technology-based companies, including Alibaba, Tencent, and Taiwan Semiconductor Manufacturing. The ETF does contain a lot of exposure to the Chinese market.
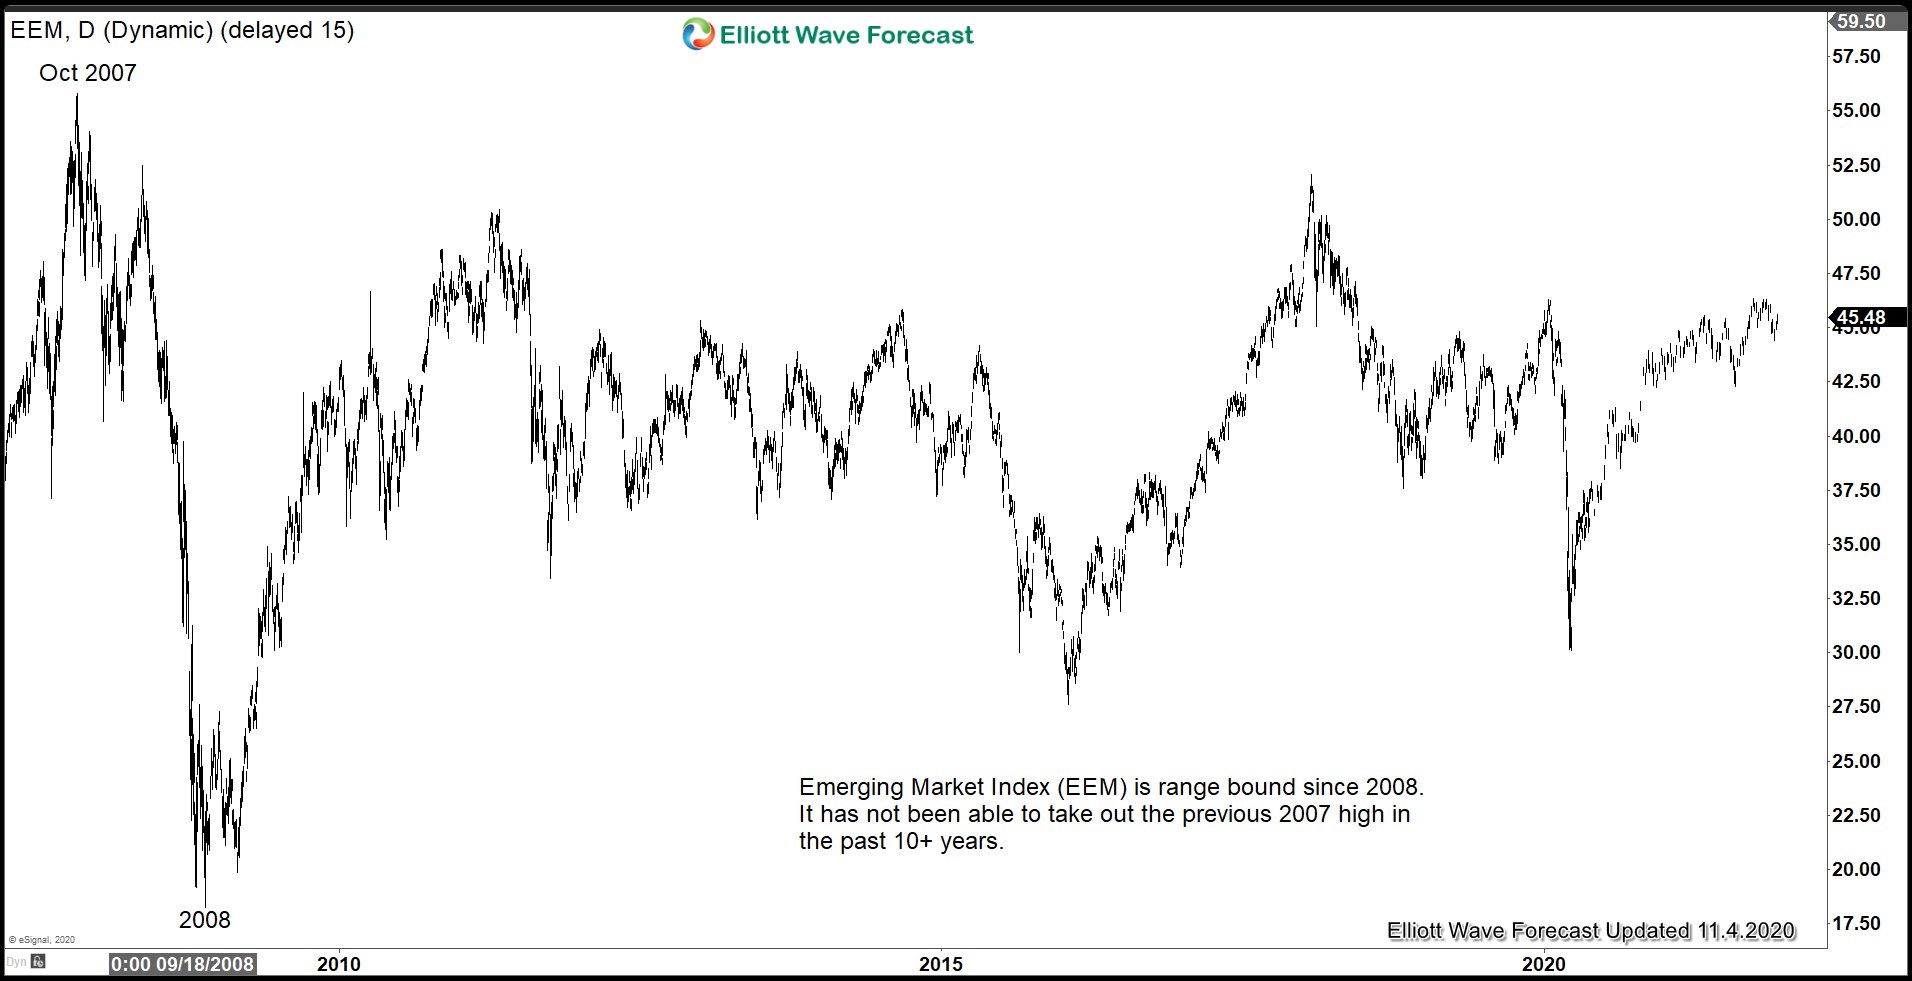
A look at the chart of the EEM below suggests a range bound performance in the past 10+ years. Since the Index bottomed in 2008, it has never been able to make a new high, unlike the US Indices.
Emerging Market Index is Range Bound in the Past 10 Years
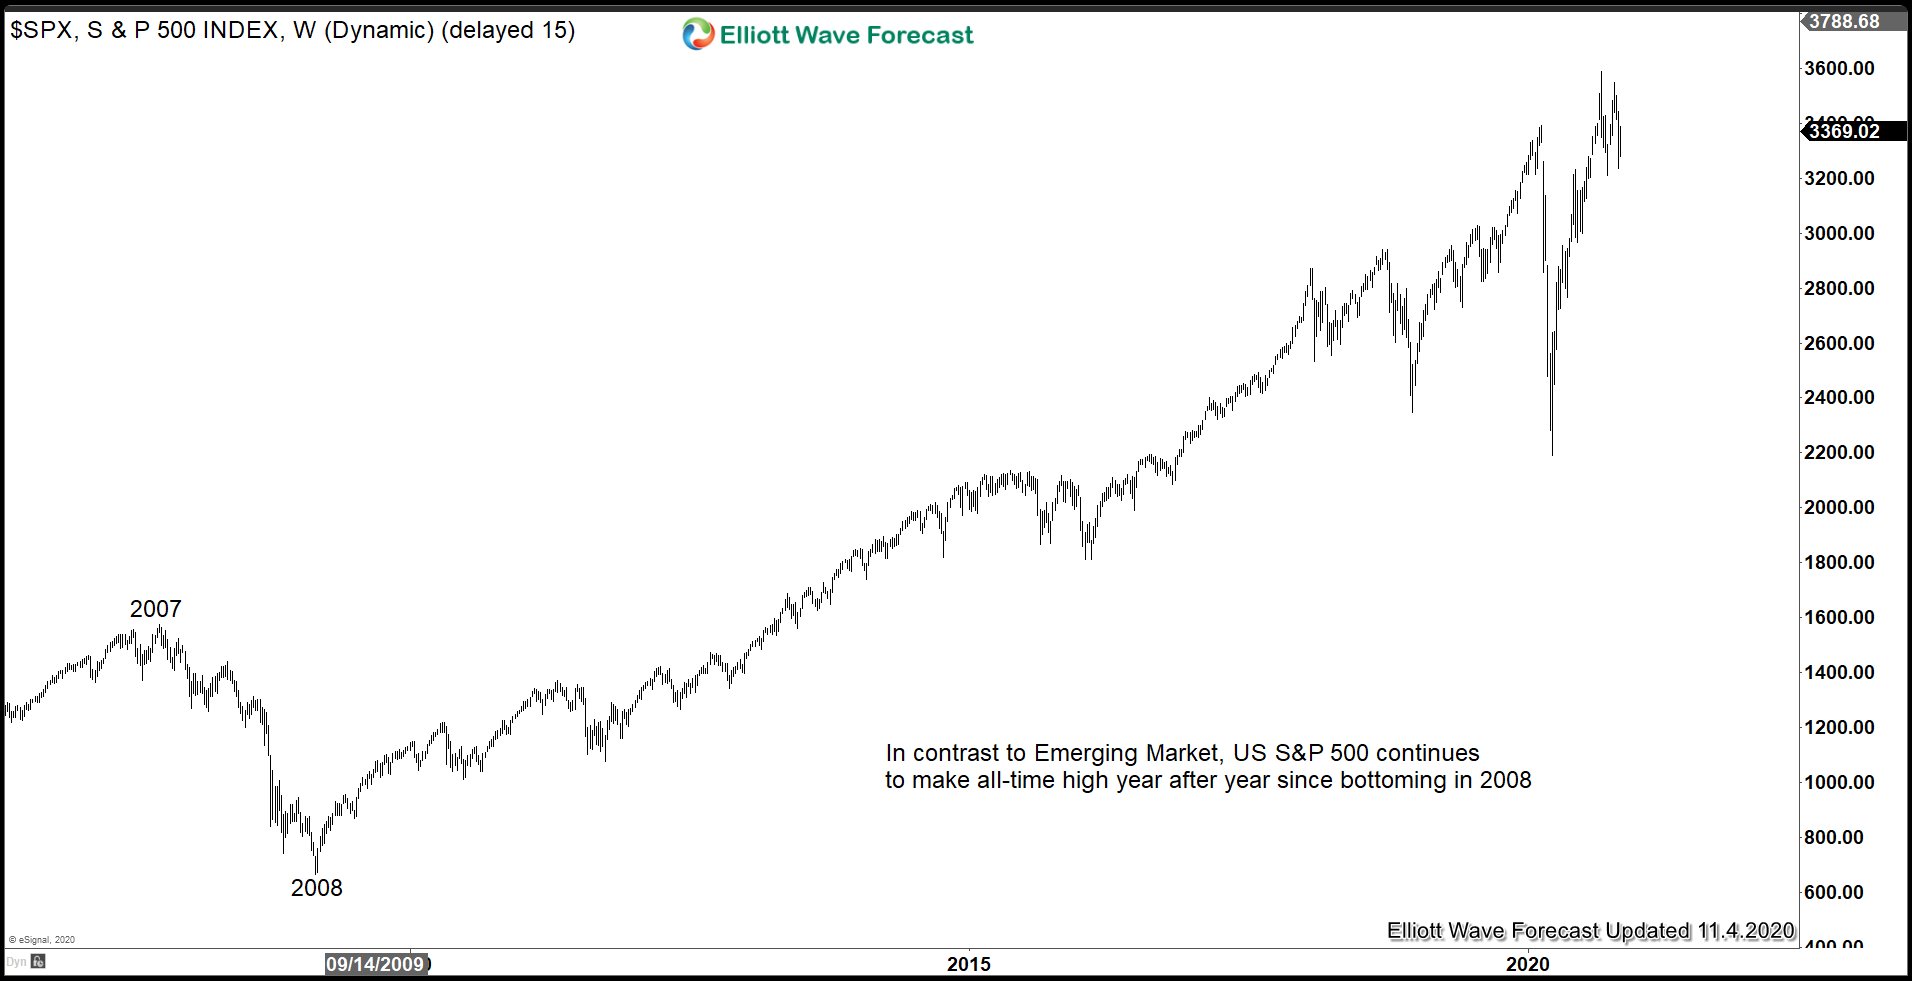
In contract, the US Index S&P 500 has continued to rally and makes new high year after year since it bottomed in 2008 as the chart below shows.
S&P 500 (SPX) Continues to Make New High Year After Year
When we look at the ratio chart below between EEM and SPX, the ratio continues to decline since 2010 as the performance between US and EEM decouples. US market continues to extend higher while EEM trade in a multi-year range.
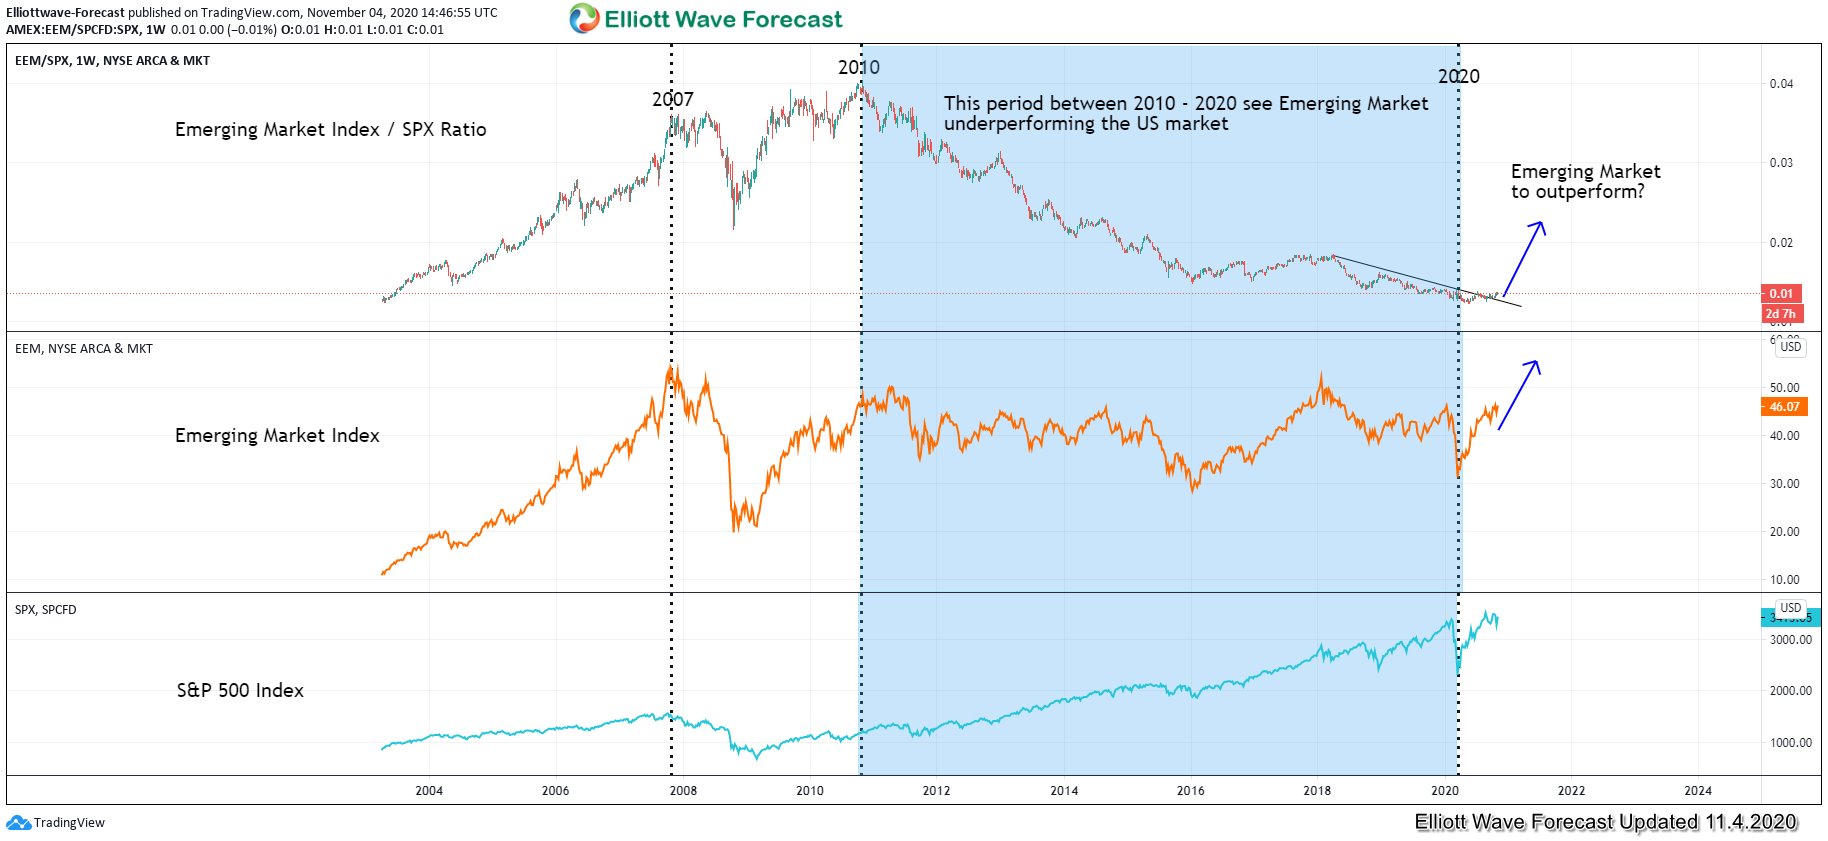
As we can see from the chart above, the ratio between EEM and SPX has gone back to the 2004 low. However, there’s an indication that the ratio may have started to reverse higher. If this is really happening, then this suggests Emerging Market is going to outperform the US market.
EEM to SPX ratio can rise due to several combination of possibilities. We’ll take a look at these three possibilities below:
- Both EEM and S&P 500 can rally, but EEM rallies more than the S&P 500. This is a possible scenario as Emerging Market generally has a higher beta than the US market, so when the ratio rallies, EEM can outperform in the rally. In this scenario, world indices in the US and outside the US continue to march higher.
- EEM rallies while S&P 500 trades in a big range. This is also a possibility. In this scenario, basically S&P 500 and Emerging Market switches role. If the period of 2010 – 2020 sees emerging market range trading and S&P 500 continues to rally, then when the ratio reverses higher, the opposite can happen. In this scenario, the baseline is there’s no crash in the market. US market at worst case will be range trading
- Both EEM and S&P 500 decline. Since the ratio rises, then this suggests S&P 500 declines much more than the Emerging Market. Although this scenario is not totally impossible, but it’s the least likely as true risk off scenario such as the 2007-2008 sees the ratio declines precipitously.
From here, we can make conclusion that if our assumption is correct that the ratio is about to reverse, it’s unlikely to see a big crash in world indices anytime soon.