Hello fellow traders. In this technical blog we’re going to take a quick look at the Elliott Wave charts of $XLV published in members area of the website. We’ve been calling for further rally in $XLV within the cycle from the March 73.86 low. Recently we got 3 waves pull back in wave ((4)) that has ended perfectly at the Equal legs. In further text we’re going to explain Elliott Wave Forecast and price structure.
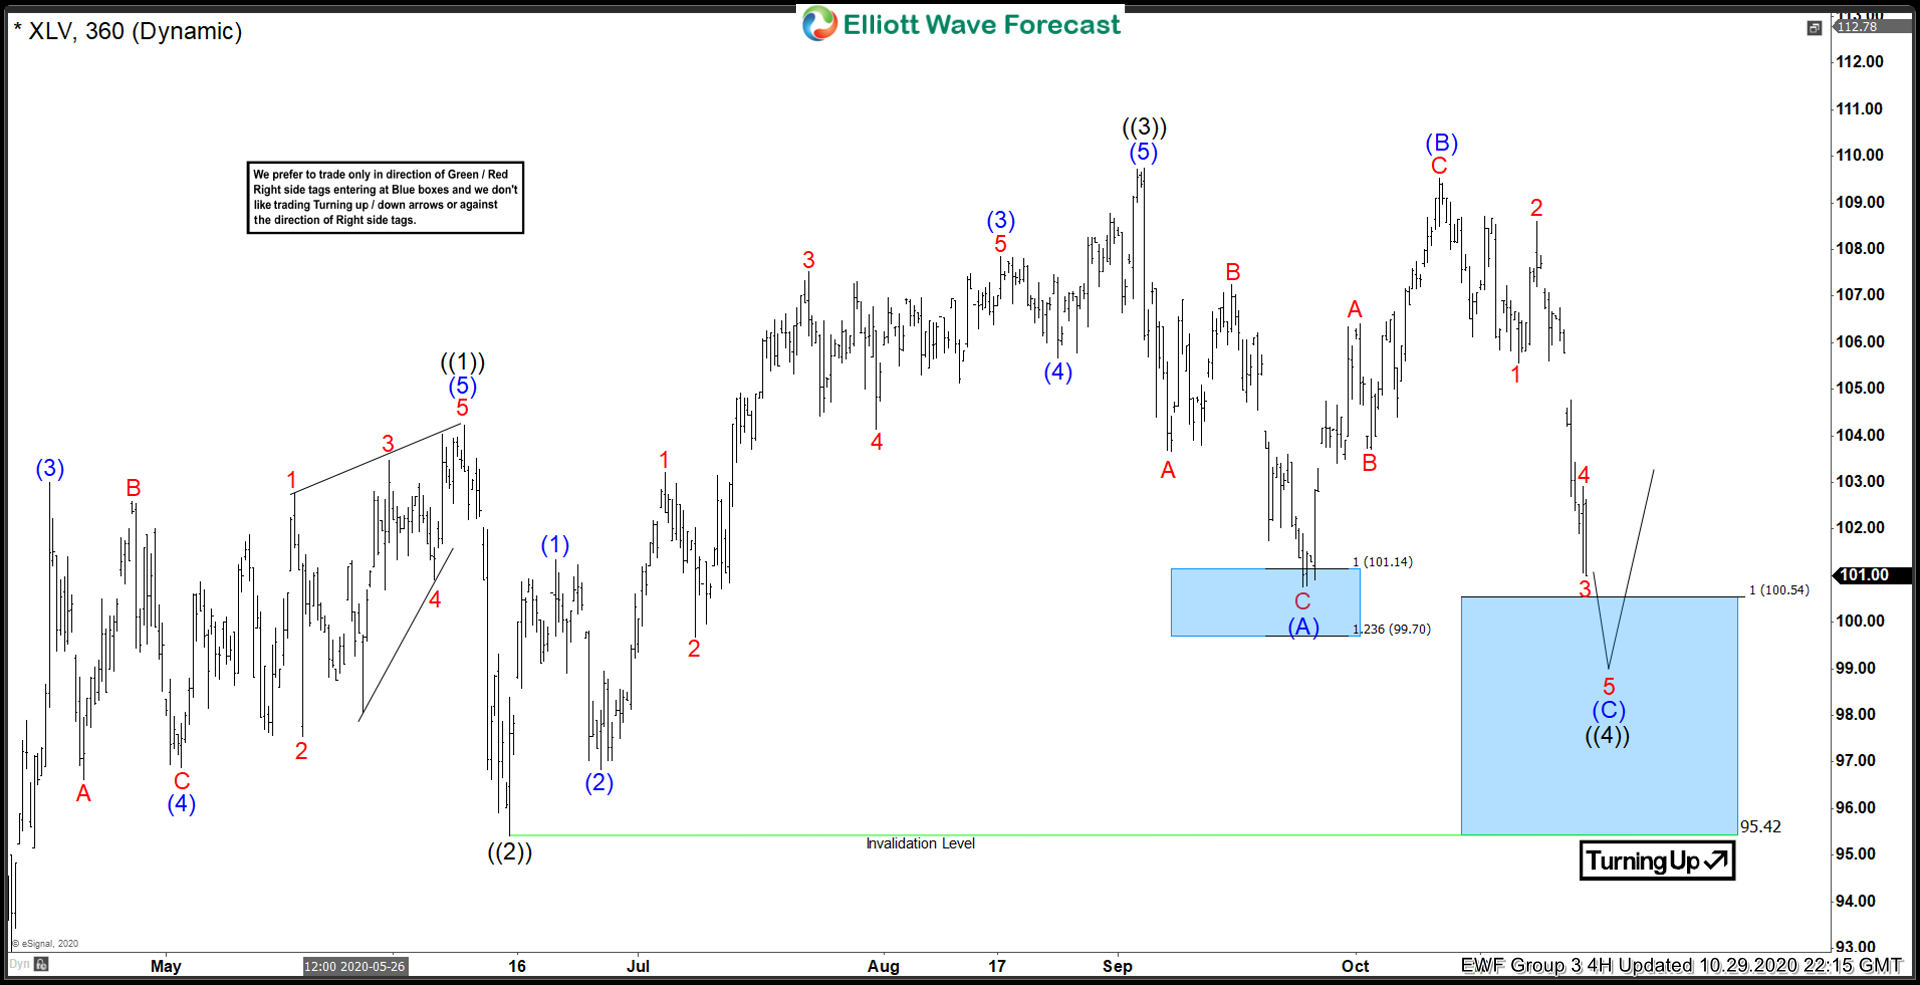
$XLV 4 Hour Elliott Wave Analysis 10.29.2020
Current view suggests March cycle is still in progress as 5 waves structure. Short term cycle from the 95.42 low ended as 5 waves rally , labeled as ((3)) black on the charts. Currently we are getting wave ((4)) black pull back that is unfolding as Elliott Wave Flat Pattern. First leg (A) blue ended as clear 3 waves pattern ABC red. Then we got 3 waves up in (B) blue, that was very deep correction against the peak. Finally we are getting decline in wave (C) that is still unfolding as 5 waves structure. The price is now reaching equal legs area at 100.54-95.42 where buyers should ideally appear for further rally in wave ((5)) toward new highs.
You can learn more about Elliott Wave Flat Patterns at our Free Elliott Wave Educational Web Page.
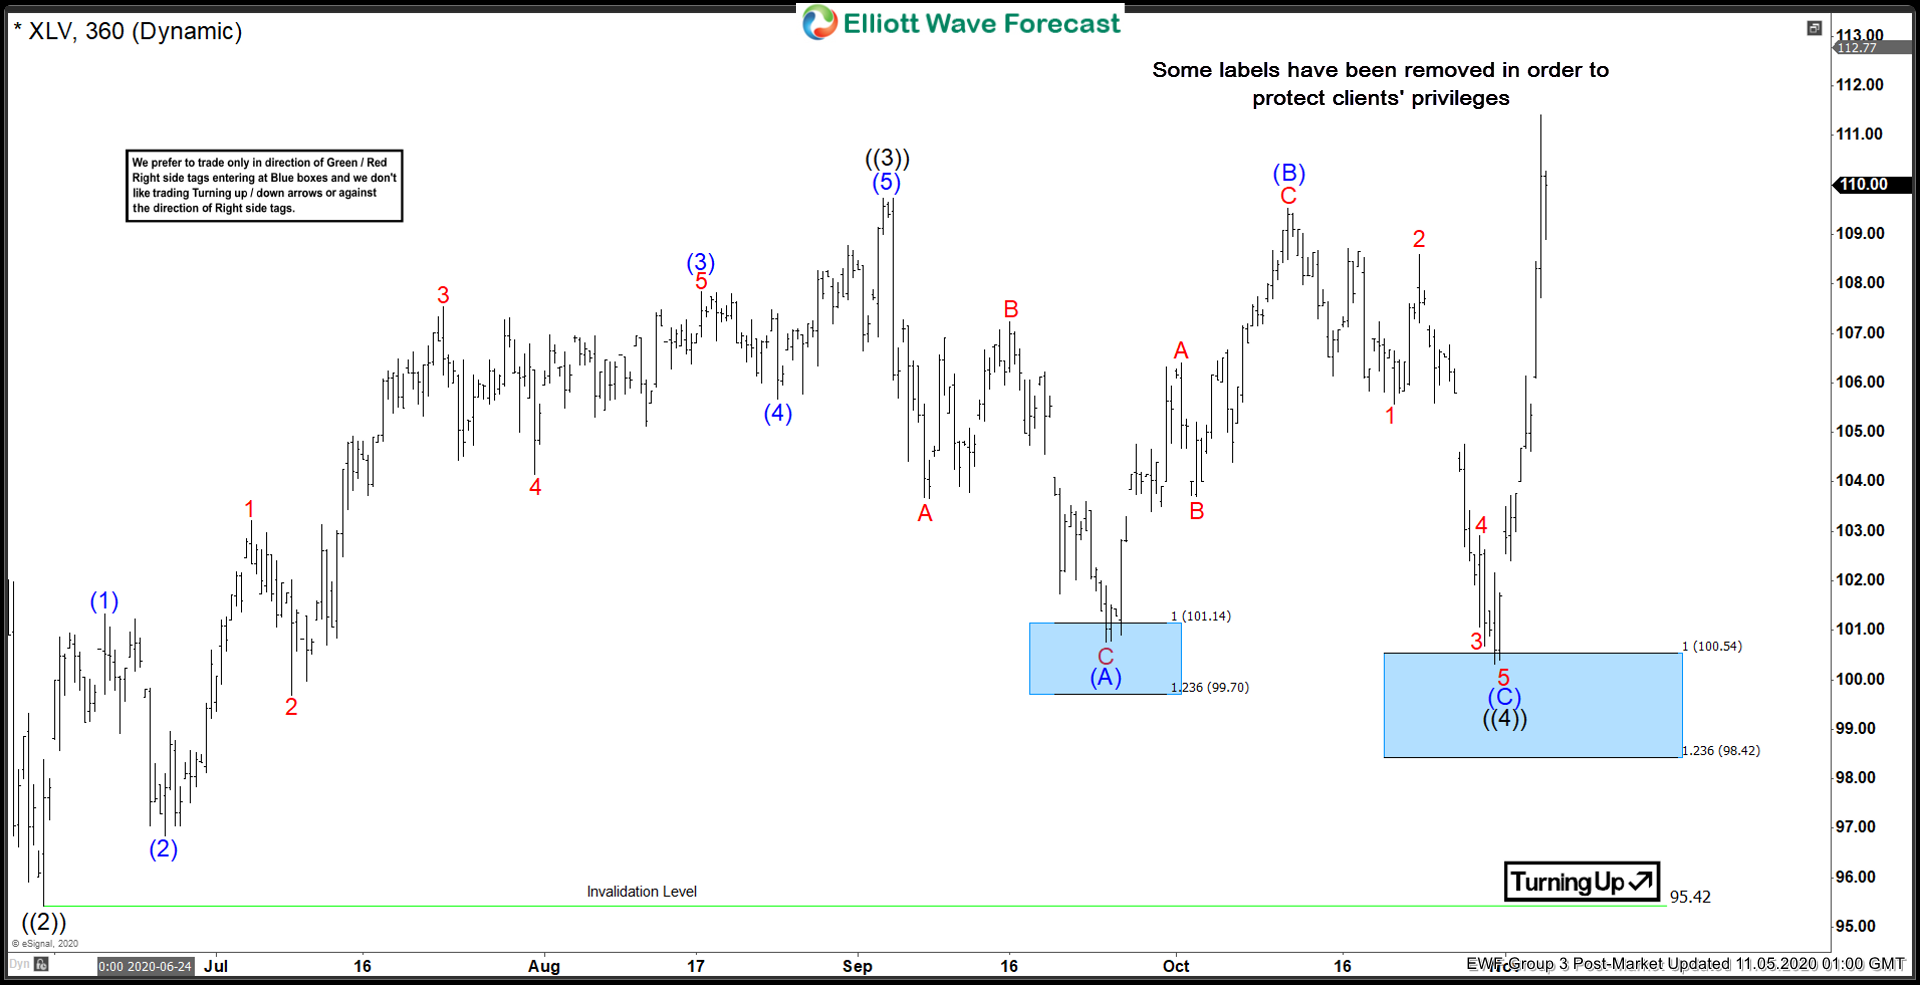
$XLV 4 Hour Elliott Wave Analysis 11.05.2020
Eventually XLV made another short term low toward Blue Box ( buyers zone). Wave ((4)) pull back ended as Elliott Wave Flat Pattern. Buyers were strong enough to push the price higher and we got broke above September 2nd peak confirming next leg up is in progress. As our members know, Blue Boxes are no enemy areas , giving us 85% chance to get a bounce.
Keep in mind market is dynamic . You can check most recent charts in the membership area of the site. Best instruments to trade are those having incomplete bullish or bearish swings sequences.We put them in Sequence Report and best among them are shown in the Live Trading Room.
Elliott Wave Forecast