
In this technical blog, we are going to take a look at the past performance of EURJPY, 4-Hour Elliott wave Charts that we presented to our members. But before looking into the Charts, we need to understand the market nature first. The market always fights between the two sides i.e Buying or Selling. We at Elliott Wave Forecast understand the Market Nature and always recommend trading the no-enemy areas. We called those no-enemy areas which are reflected as blue box areas on our Charts. They usually give us the reaction in favor of market direction in 3 swings at least. Now, let us take a quick look at the EURJPY Charts and structure below:
EURJPY 4 Hour Elliott Wave Chart
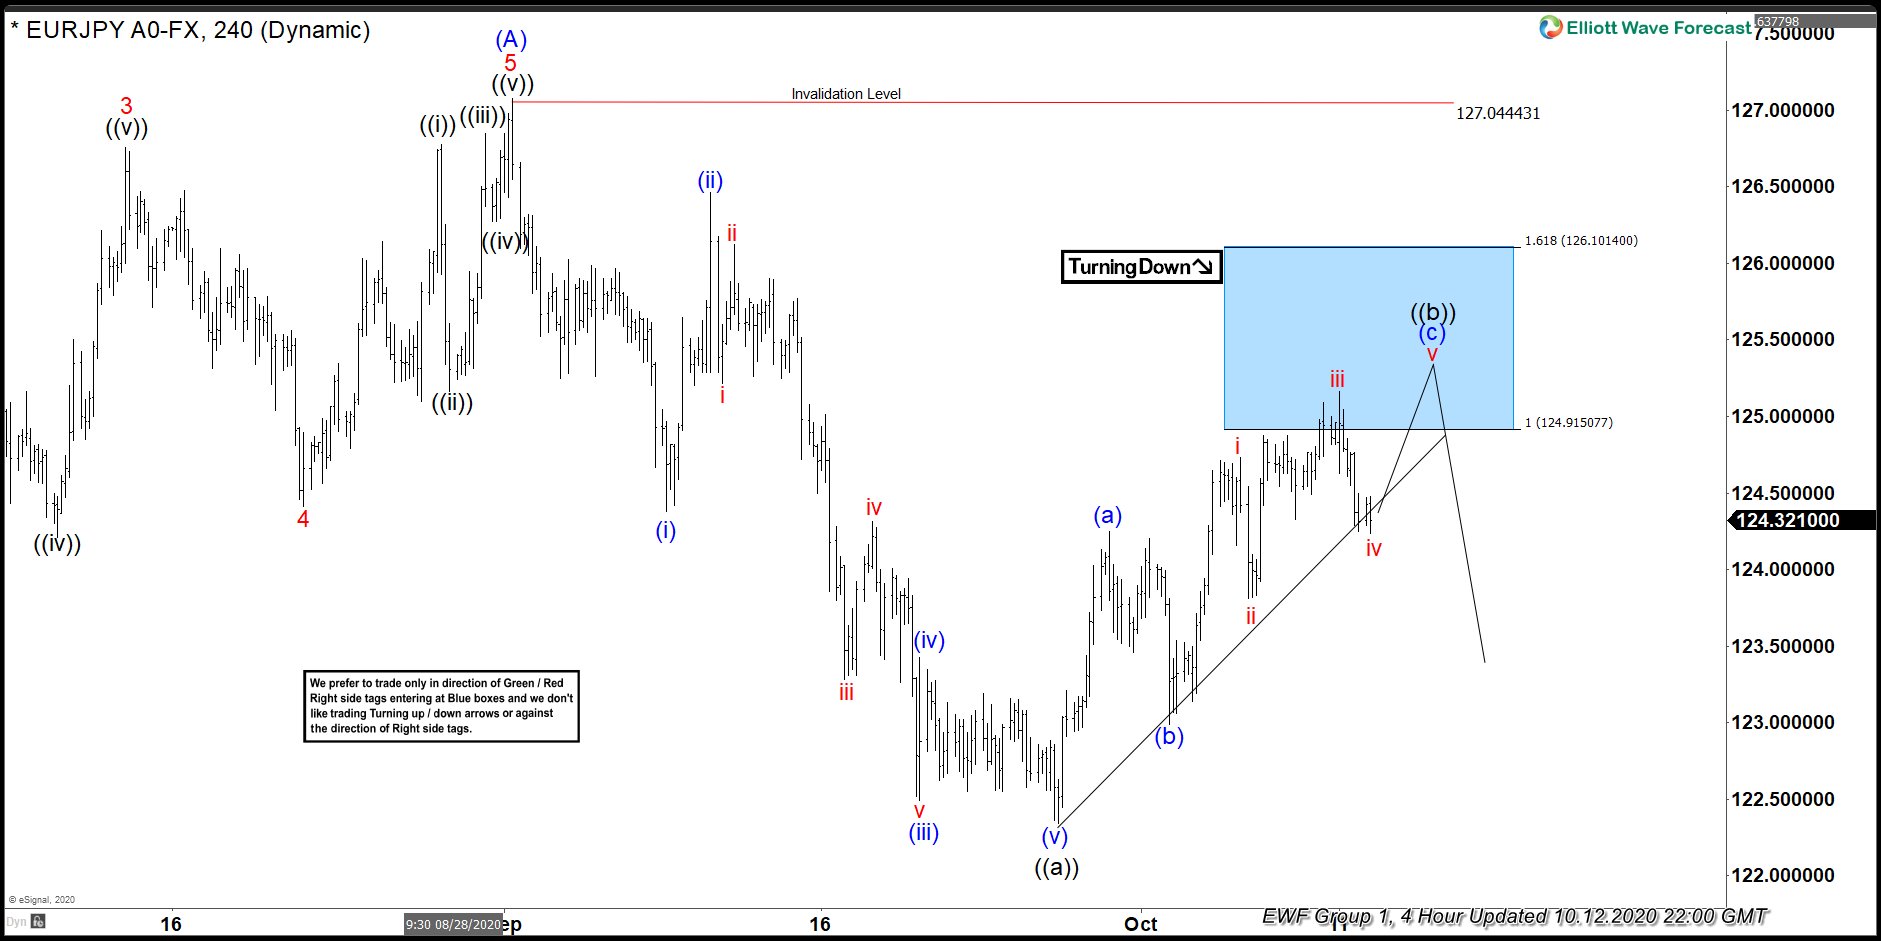
The decline from September 01, 2020 peak unfolded in 5 waves impulse structure thus suggested that it’s a continuation pattern. Therefore, wave ((b)) bounce was expected to fail in 3 or 7 swings for another 5 wave extension lower. Above is the 4 Hour Elliott wave Chart from the 10/12/2020 update. In which the decline to 122.34 low ended wave ((a)) as 5 waves impulse structure. Up from there, the bounce from the lows unfolded as a zigzag structure in a lesser degree cycle. When wave (a) ended at 124.50 high, wave (b) pullback ended at 122.99 low. Wave (c) was expected to reach the no enemy area at 124.91-126.10 100%-161.8%Fibonacci extension area of (a)-(b). From there, the pair was expected to resume the next extension lower or to do a 3 wave reaction lower at least.
EURJPY 4 Hour Elliott Wave Chart
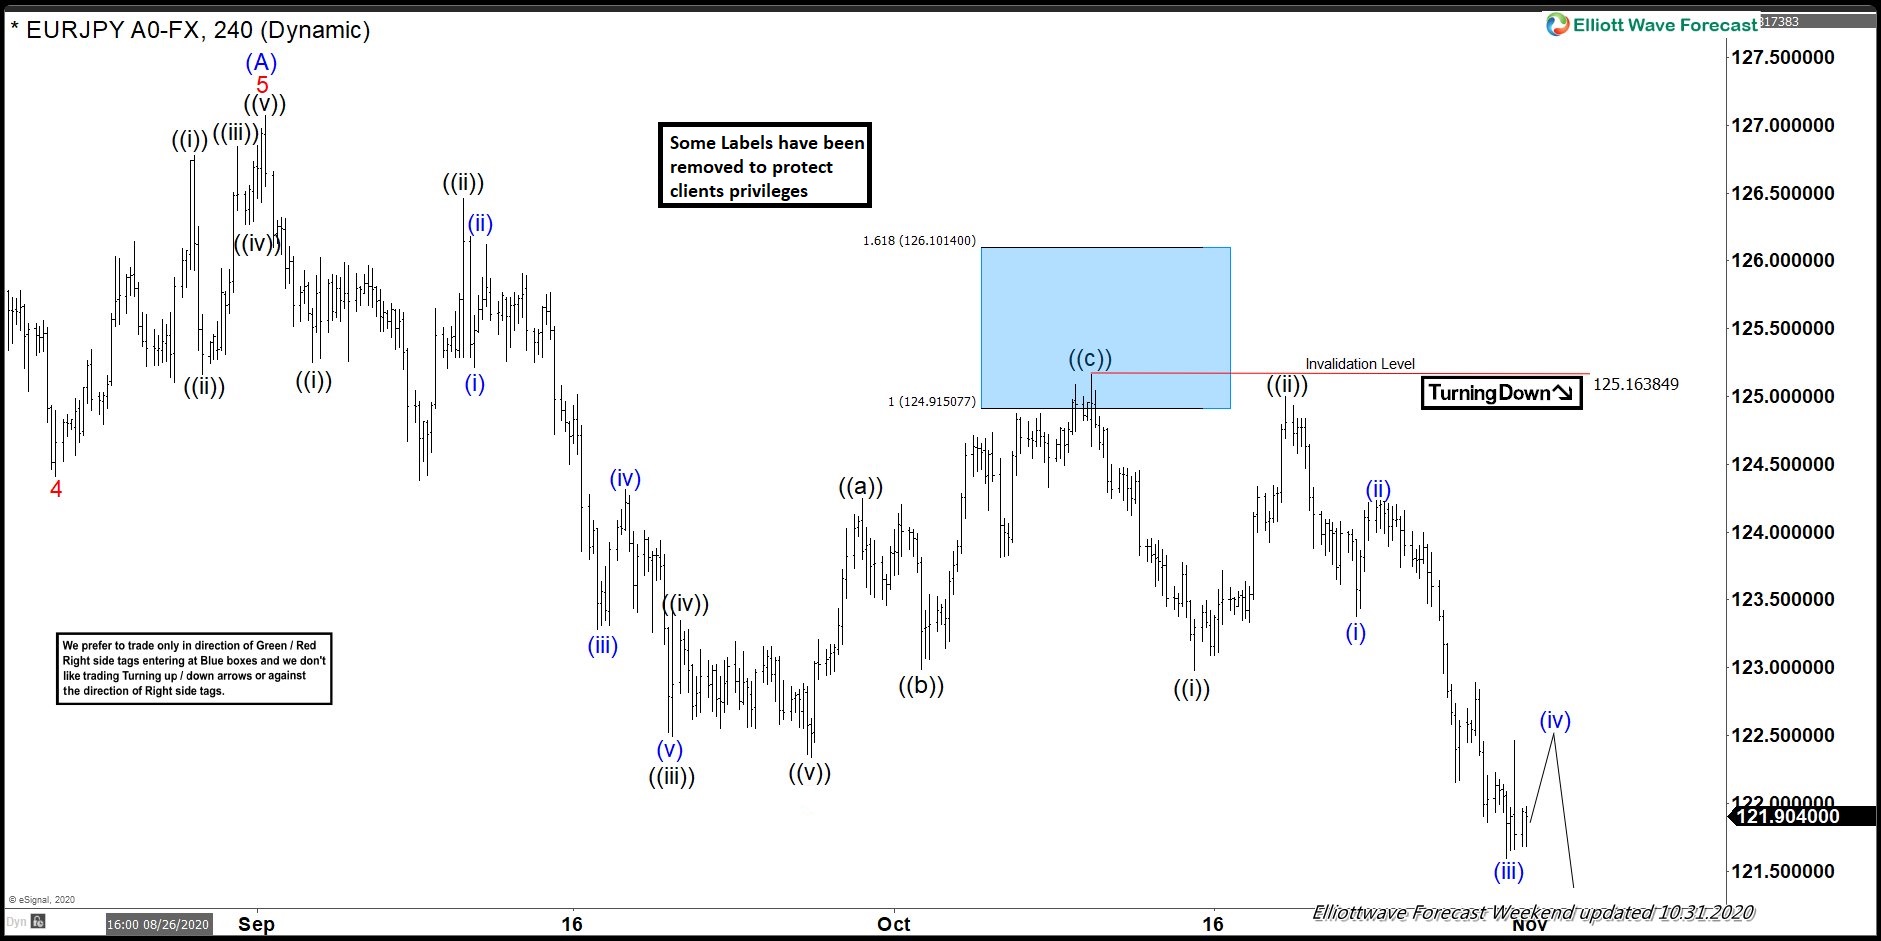
Here’s 4 Hour Elliott Wave Chart from the 10/31/2020 Weekend update. In which the pair managed to reach the blue box area at 124.91-126.10 100%-161.8% and got rejected as expected. Allowed our members to create a risk-free position shortly after taking the short positions as per Elliott wave hedging.