United Internet AG is a global internet services company. Founded 1988, headquartered in Montabaur, Germany, and traded under the ticker $UTDI at FSE, it is a component of the TecDax index. First of all, United Internet comprises two units, Access and Applications. In particular, it owns the leading internet service providers in Germany as well as major email providers such as GMX, mail.com and web.de. In total, it has 13 brands and numerous subsidiaries. Also, company operates its own internet backbone. This year, as a matter of fact, we saw technology stocks leading the rally in US. Hereby, United Internet as a heavyweight in TecDAX should become an excellent opportunity for technology oriented investors.
United Internet Monthly Elliott Wave Analysis 09.10.2020
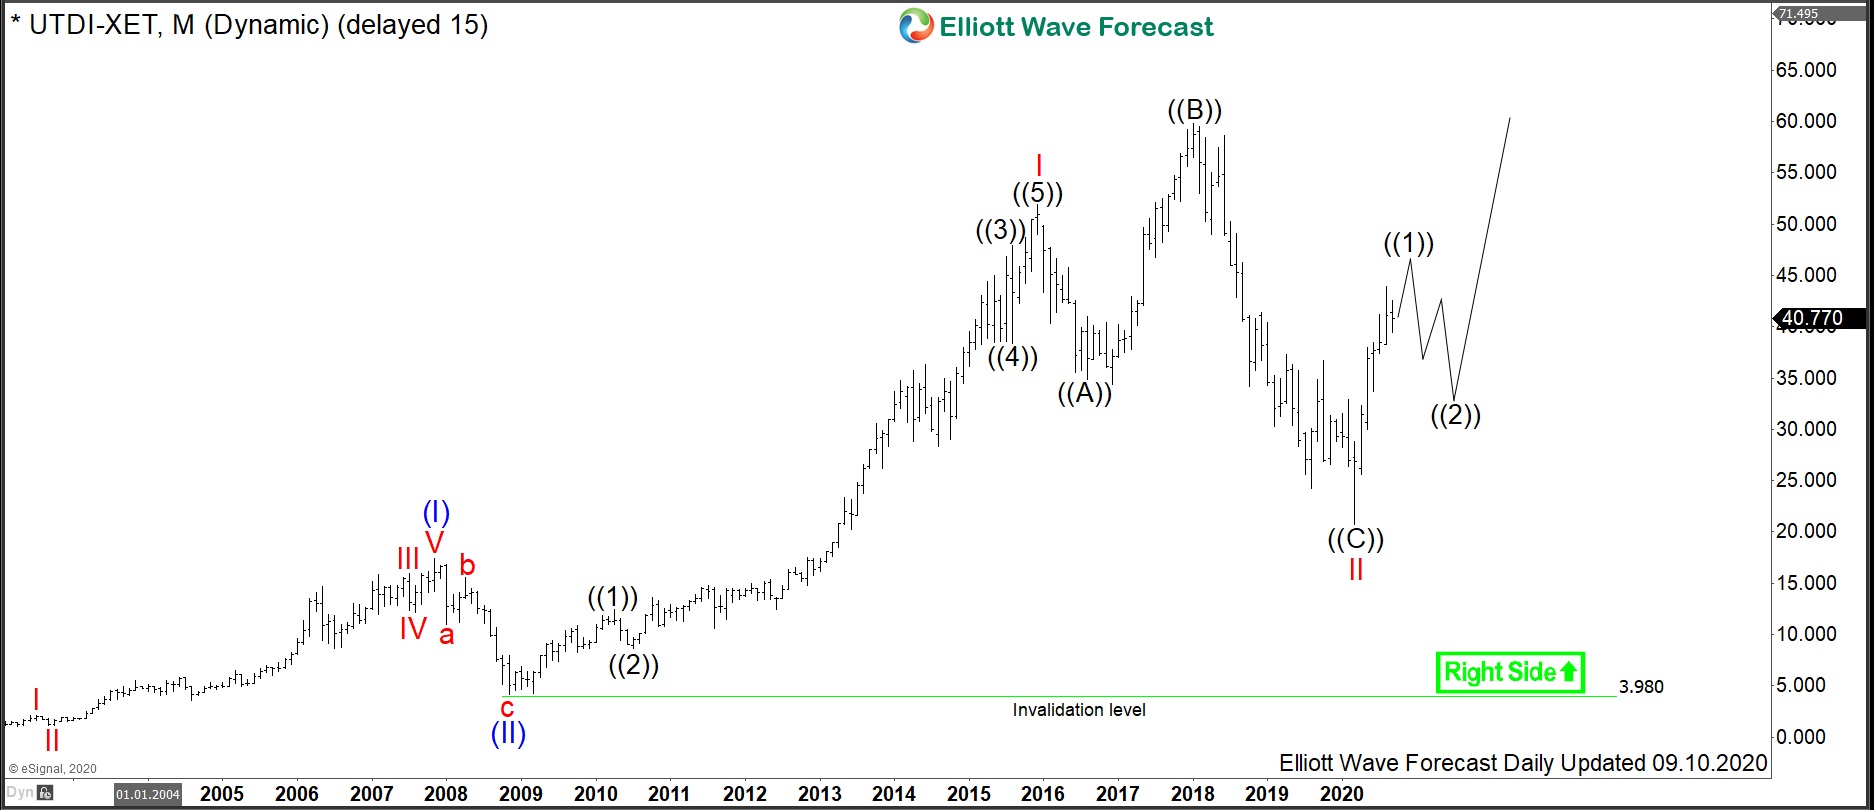
The monthly chart below shows the United Internet shares $UTDI traded at Frankfurt Stock Exchange. From the all-time lows, the stock price has developed a cycle higher in wave (I) towards 17.47 highs on November 2007. After the primary impulse higher, a correction lower in wave (II) has ended on November 2008 at 3.98.
From the November 2008 lows, a new cycle has started breaking the 17.47 highs. The red wave I has ended in December 2015 at 51.96. Hereby, within the impulsive advance, all the subwaves ((1)), ((3)) and ((5)) are impulsive waves, too. Wave ((3)) demonstrates a clear extension in price. From the December 2015 highs, a correction in wave II has unfolded as an expanded flat pattern. To recall, expanded flats are corrective structures which do, however, print a new high in price. As a matter of fact, we saw the all-time highs in wave ((B)) of II in January 2018 at 59.80. From there, the wave ((C)) has accomplished the pattern by printing the low in March 2020 at 20.69.
From the March lows, a new cycle in wave III of (III) may have started to the new highs. Break of 51.96-59.80 would confirm that. As of right now, the price is turning higher in a black wave ((1)). Once finished, pullback in wave ((2)) should find support in 3, 7, 11 swings above 20.69 lows for another extension higher in wave ((3)).
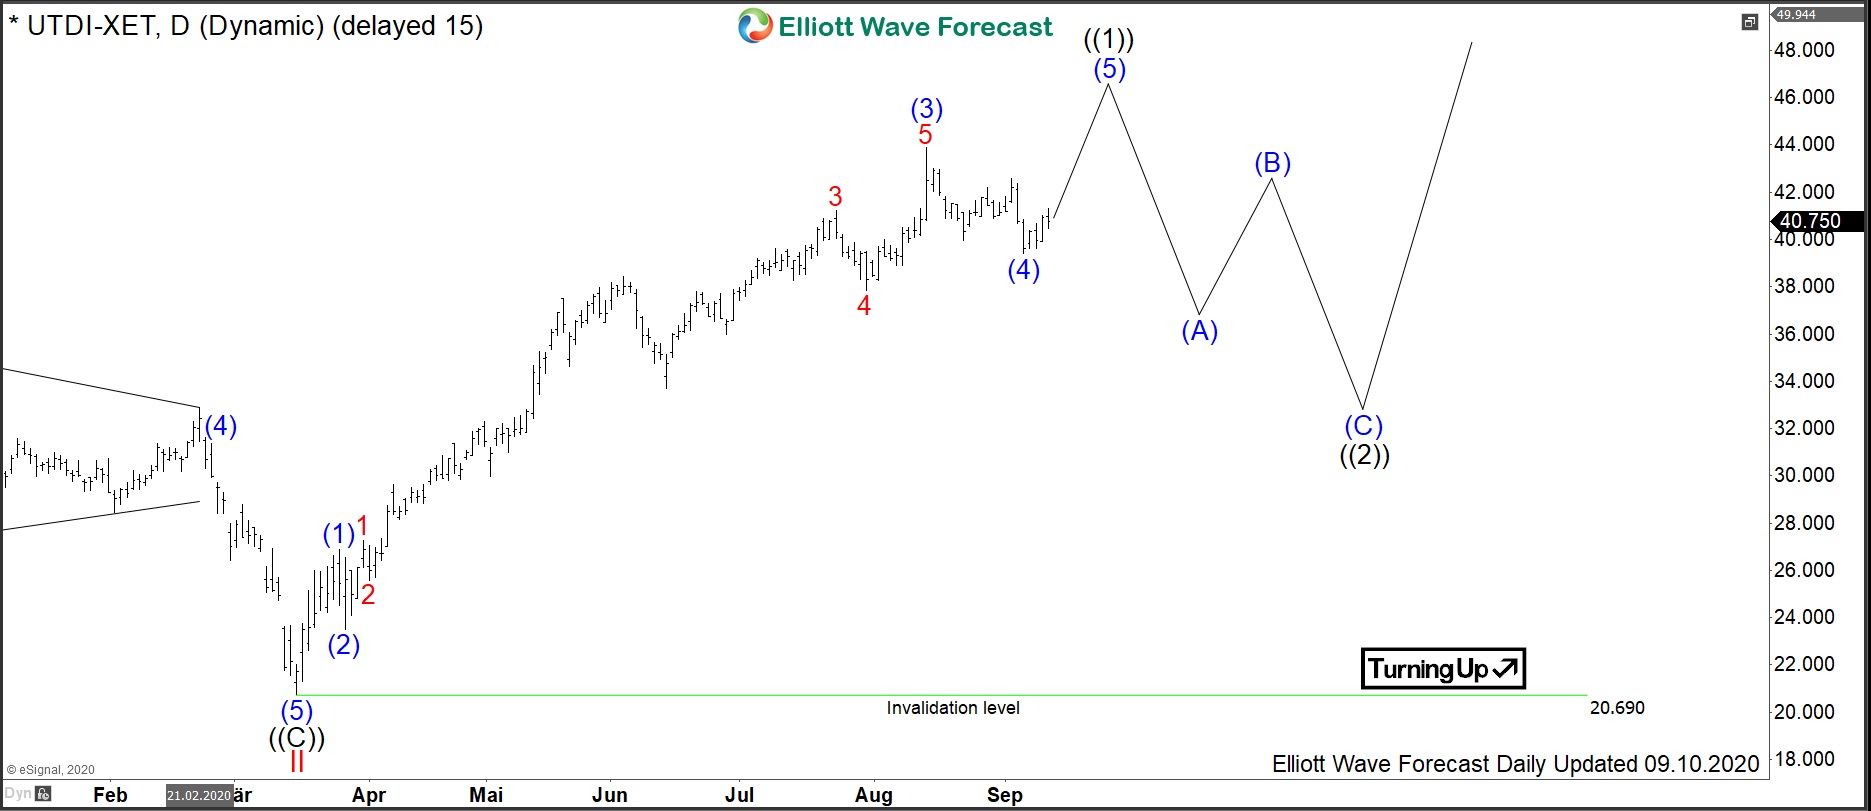
United Internet Daily Elliott Wave Analysis 09.10.2020
The Daily chart below shows the $UTDI shares price action in more detail. From the March lows at 20.69, the stock price has advanced in blue waves (1) – (3) of the black wave ((1)). Currently, the correction lower in wave (4) might have ended. Now, the UTDI stock may be extending to new highs in blue wave (5). Once the march cycle in wave ((1)) has finished, expect a pullback in wave ((2)) to find support in 3, 7 or 11 swings above 20.69 lows for a possible acceleration in wave ((3)) of III.
As an outlook, the new cycle in red wave III should bring the prices towards 51.96-59.80 and above. The target for wave III will be 68.70-98.36. Hereby, investors in technology stocks may be looking for an opportunity to buy UTDI in a pullback against 20.69 lows with an excellent risk-reward potential.