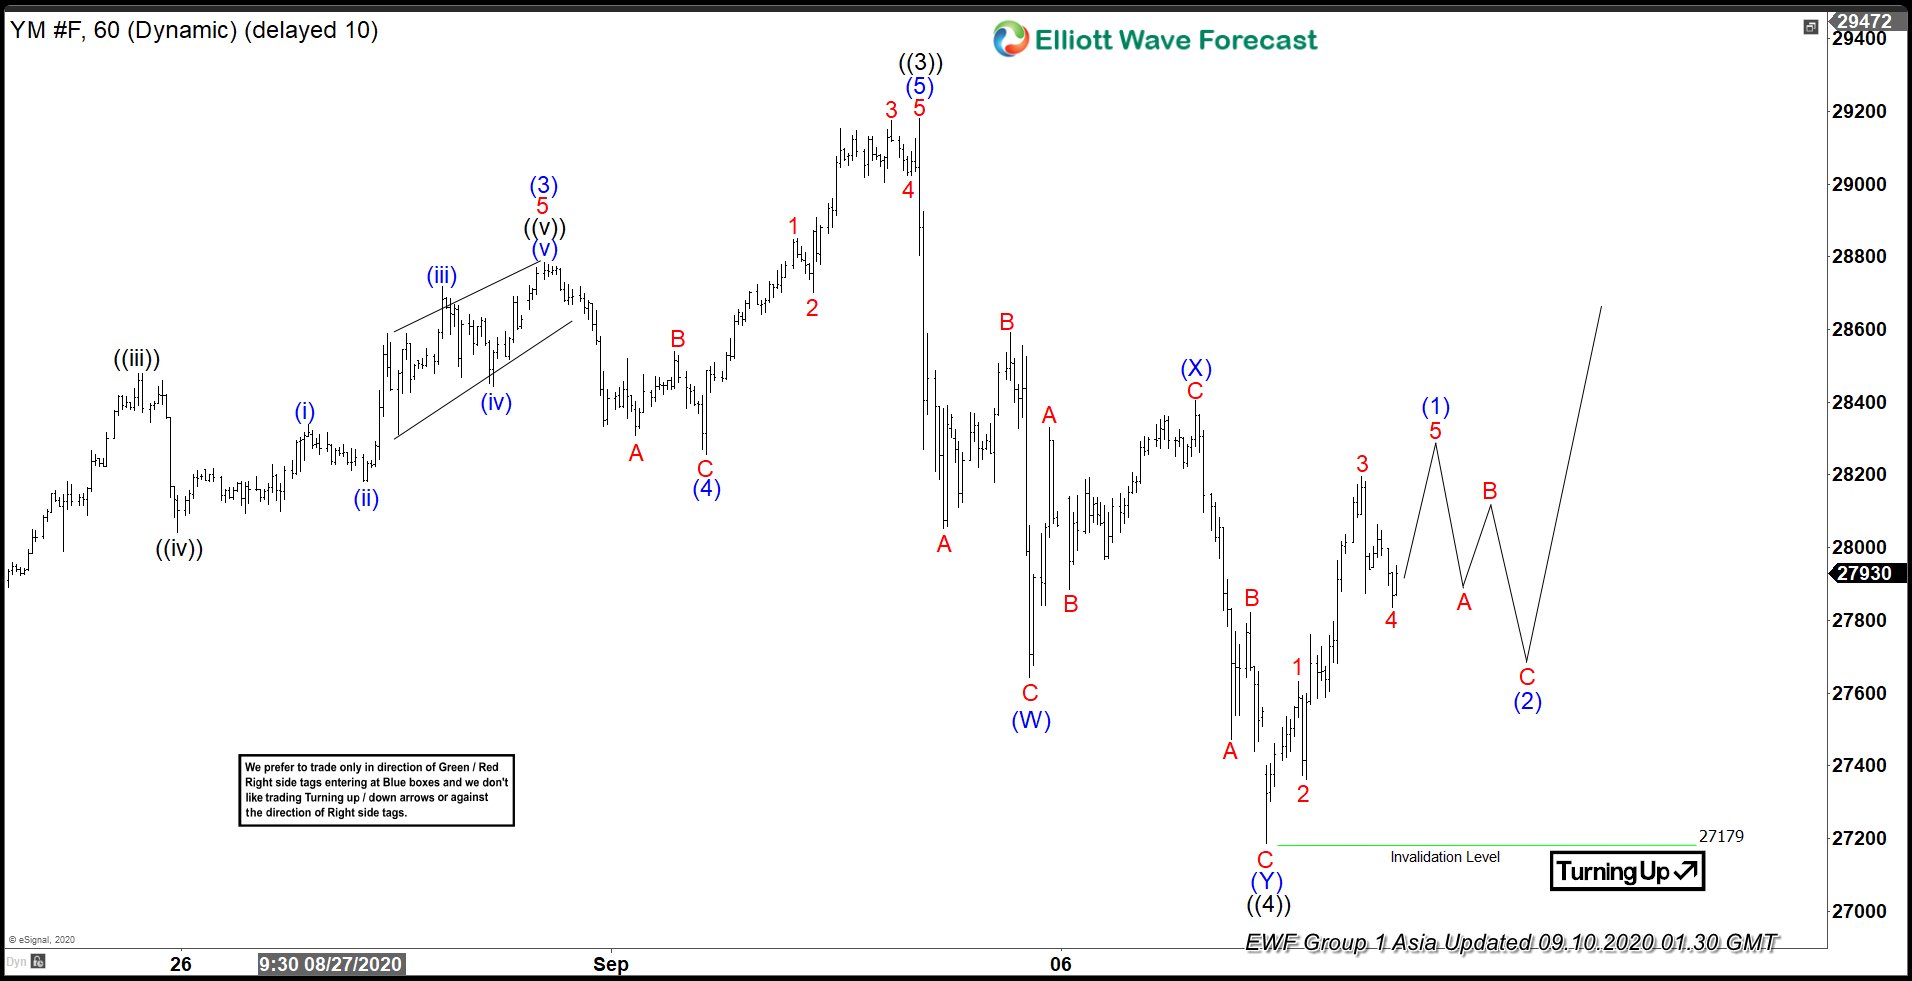
Elliott Wave View of Dow Futures (YM) suggests the Index ended the cycle from June 15 low as wave ((3)) at 29180 high. Afterwards, Index did a pullback in wave ((4)) to correct against that cycle. The correction unfolded as a double three Elliott Wave Structure. Down from wave ((3)) high, wave A ended at 28052 low. The bounce in wave B ended at 28592 high. Index then resumed lower and ended wave C at 27707 low. This completed wave (W) in higher degree.
Afterwards, Index bounced higher in wave (X) to correct against the cycle from September 3 high. The subdivision of the bounce unfolded as zigzag correction, where wave A ended at 28331 high, wave B ended at 27886 low and wave C ended at 28404 high. After that, Index then resumed lower. Down from wave (X) high, wave A ended at 27473 low and wave B ended at 27821 high. Finally, wave C lower ended at 27179 low to end wave (Y) and also wave ((4)) in higher degree. While above 27179 low, dips in 3,7 or 11 swings is expected to continue to find support for more upside. However, Index still needs to break above September 3 high to confirm that next leg higher in wave ((5)) is already in progress.
Dow Futures 1 Hour Elliott Wave Chart