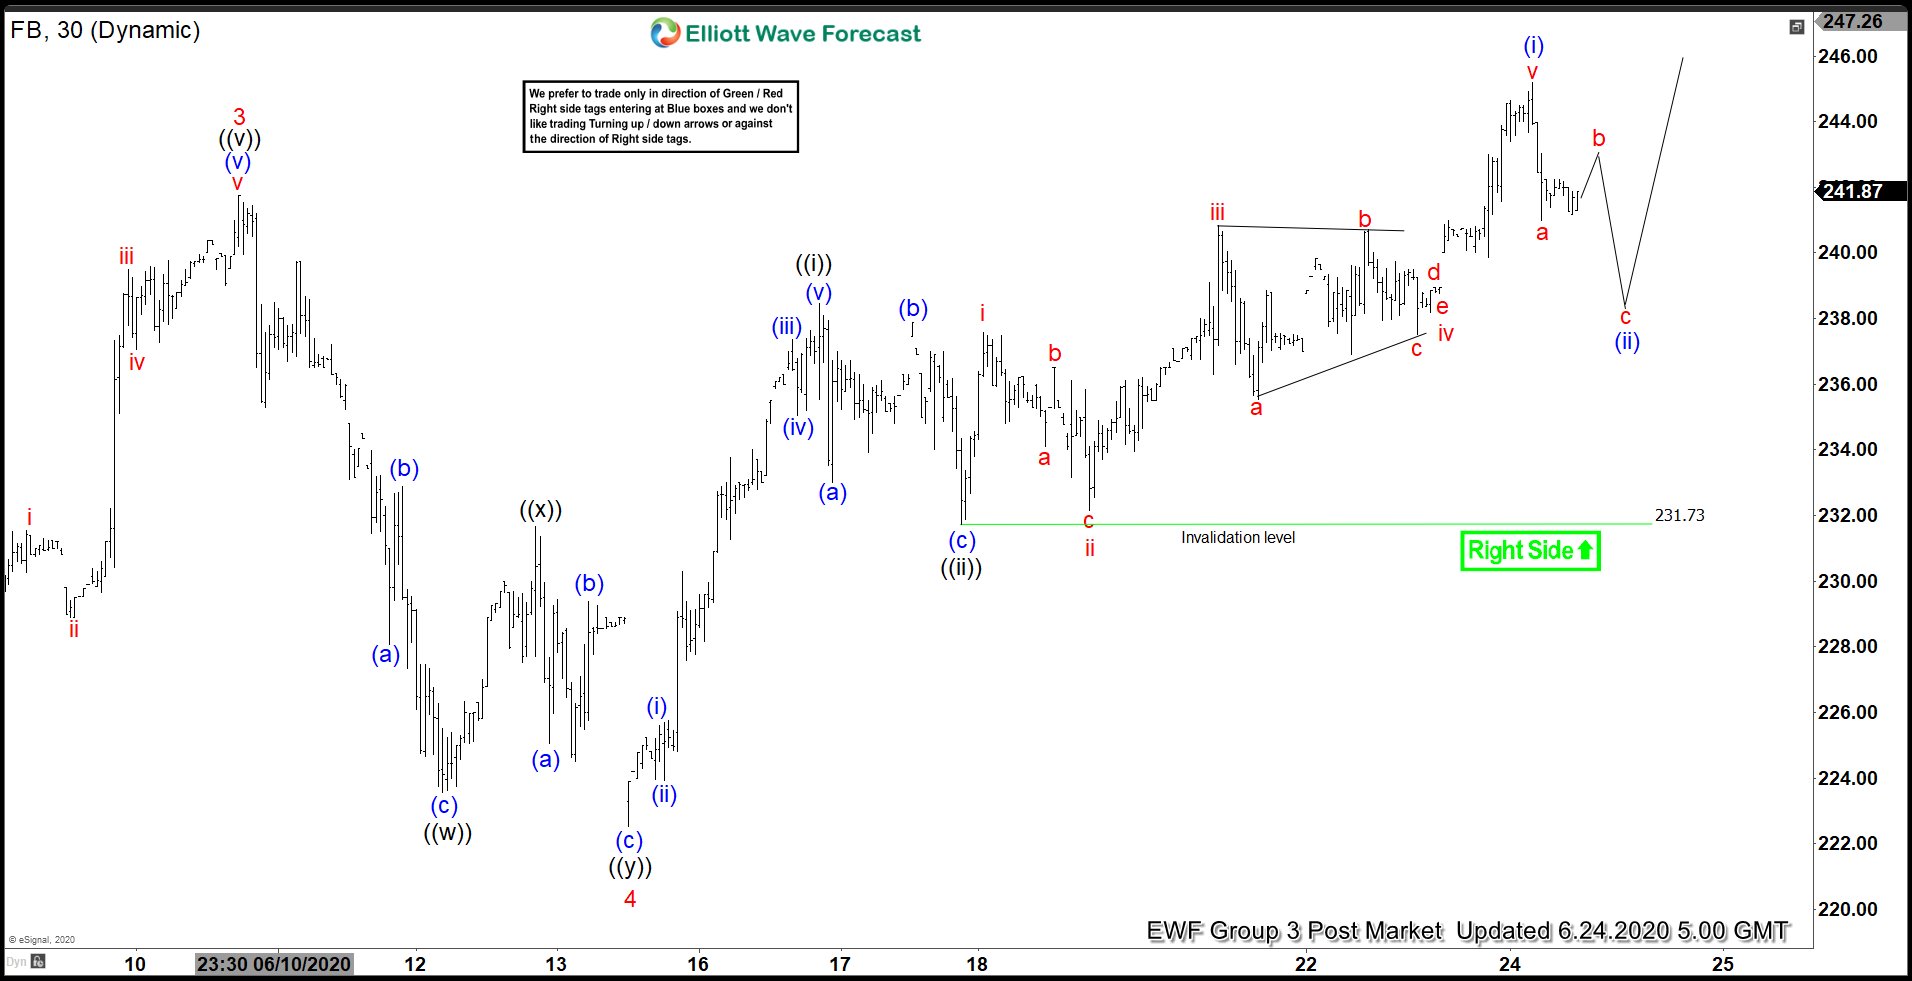
Facebook (ticker: FB) shows a higher high sequence from June 15 low, favoring further upside. The 30 minutes chart update below shows that the stock ended wave 3 at 241.75 high. Afterwards, the stock did a pullback in wave 4. Wave ((a)) ended at 223.55 low and wave ((b)) bounce ended at 231.66 high. Facebook then extended lower in wave ((c)), which ended at 222.53 low. Up from that wave 4 low, Facebook resumed higher in wave ((i)) as 5 waves impulse Elliott Wave Structure. That rally in wave ((i)) ended at 238.46 high. From there, the stock did a pullback in wave ((ii)), which unfolded as a zig-zag Elliott Wave Structure. Wave (a) ended at 233 low and the bounce in wave (b) ended at 237.88 high. Facebook then declined lower to end wave (c) at 231.73 low.
The stock has resumed higher since. It has broken above the previous wave 3 high, confirming the next leg higher in wave 5 is already in progress. From wave ((ii)) low, the stock extended higher and ended wave i at 237.59 high. The pullback in wave ii ended at 232.15 low as a zigzag Elliott Wave Structure. From there, the stock resumed higher and ended wave iii at 240.83 high. Wave iv then unfolded as a triangle and ended at 238.75 low. The stock then pushed for another high in wave v, which ended wave (i) at 234.92 high. Wave ((ii)) pullback is currently in progress. Near term, while pullback stays above 231.73 low, expect the dips in 3,7, or 11 swings to find support and Facebook to continue to extend higher.
Facebook (FB) 30 Minutes Elliott Wave Chart