
$SLV Ishares Silver Trust Elliott Wave and Larger Cycles
Firstly there is data back to when the ETF fund began in 2006 as seen on the weekly chart shown below. The fund made a low in 2008 at 8.45 that has not since been taken out in price. However it can be in this current pullback although I don’t really expect that much weakness. You should be able to assume from the October 2008 lows to the April 2011 highs was a larger degree impulse ending from all time Silver lows either way.
Secondly, the decline from the April 2011 highs down to the May 2011 lows was five waves. Price held below the April 2011 highs during the bounce from the May 2011 lows to the August 2011 high.
The analysis continues below the weekly chart.
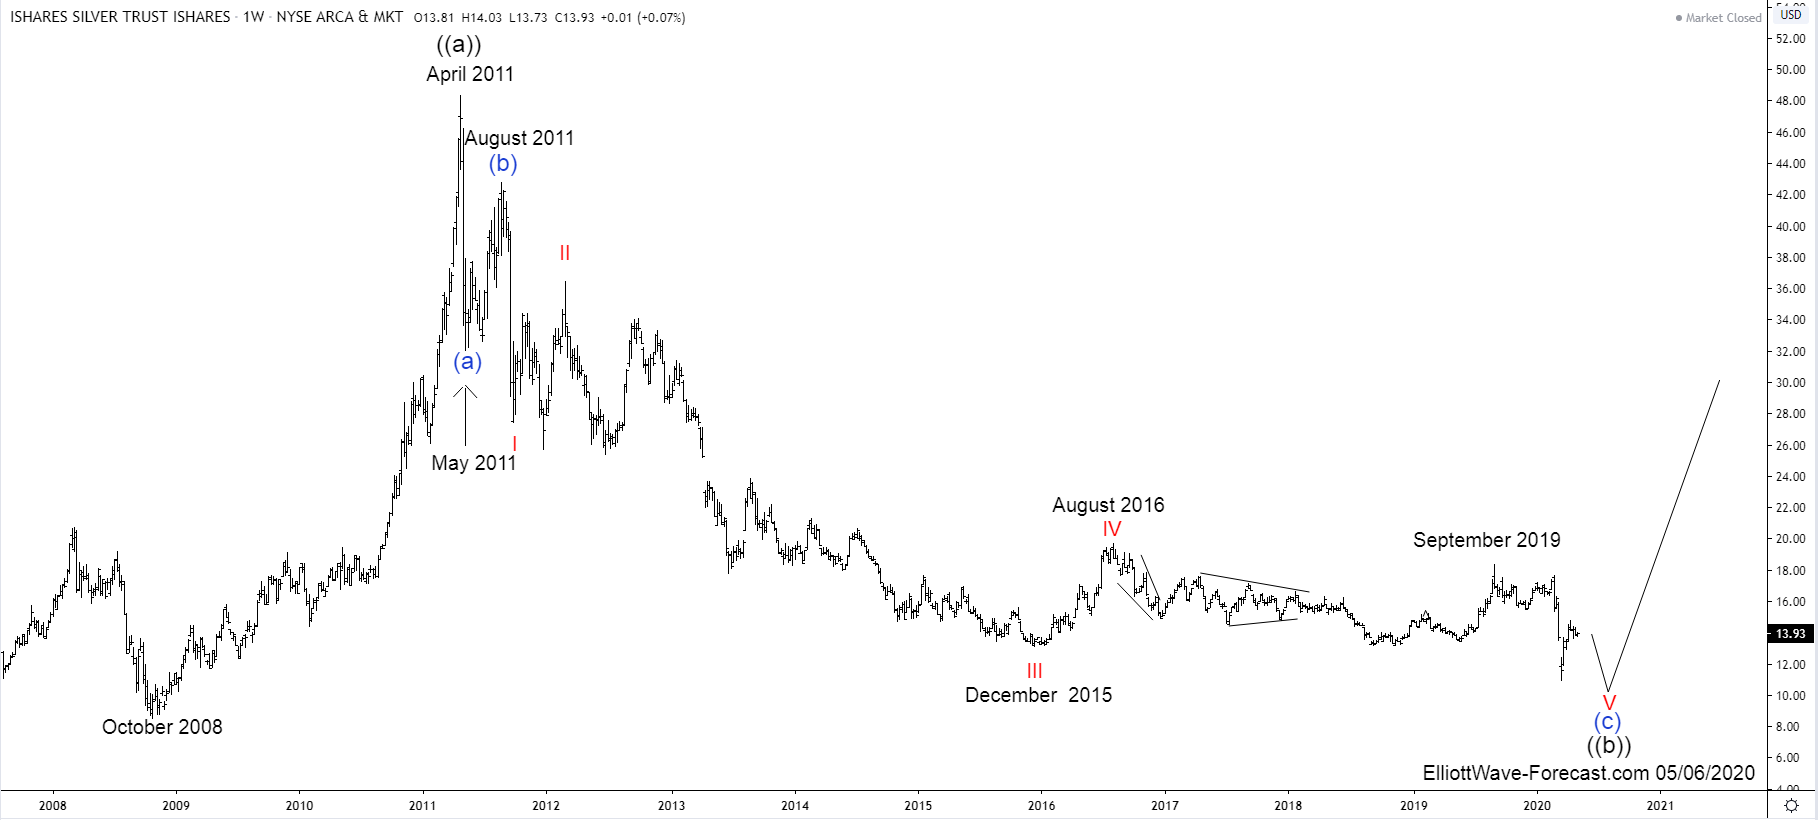
Thirdly, the cycle from the August 2011 high appears incomplete.This red I , II & III decline to the December 2015 lows best looks as two Elliott Wave impulses. Next, the bounce to the August 2016 high was strong enough to suggest it had corrected the cycle from the red wave II highs in February 2012. From the August 2016 high the decline appears to be an Elliott Wave ending diagonal structure. Ending diagonals usually will show five three swing moves with the trend. At this point in time the trend remains down while below the September 2019 highs.
The analysis concludes below the daily chart. Here is the SLV Daily Chart.
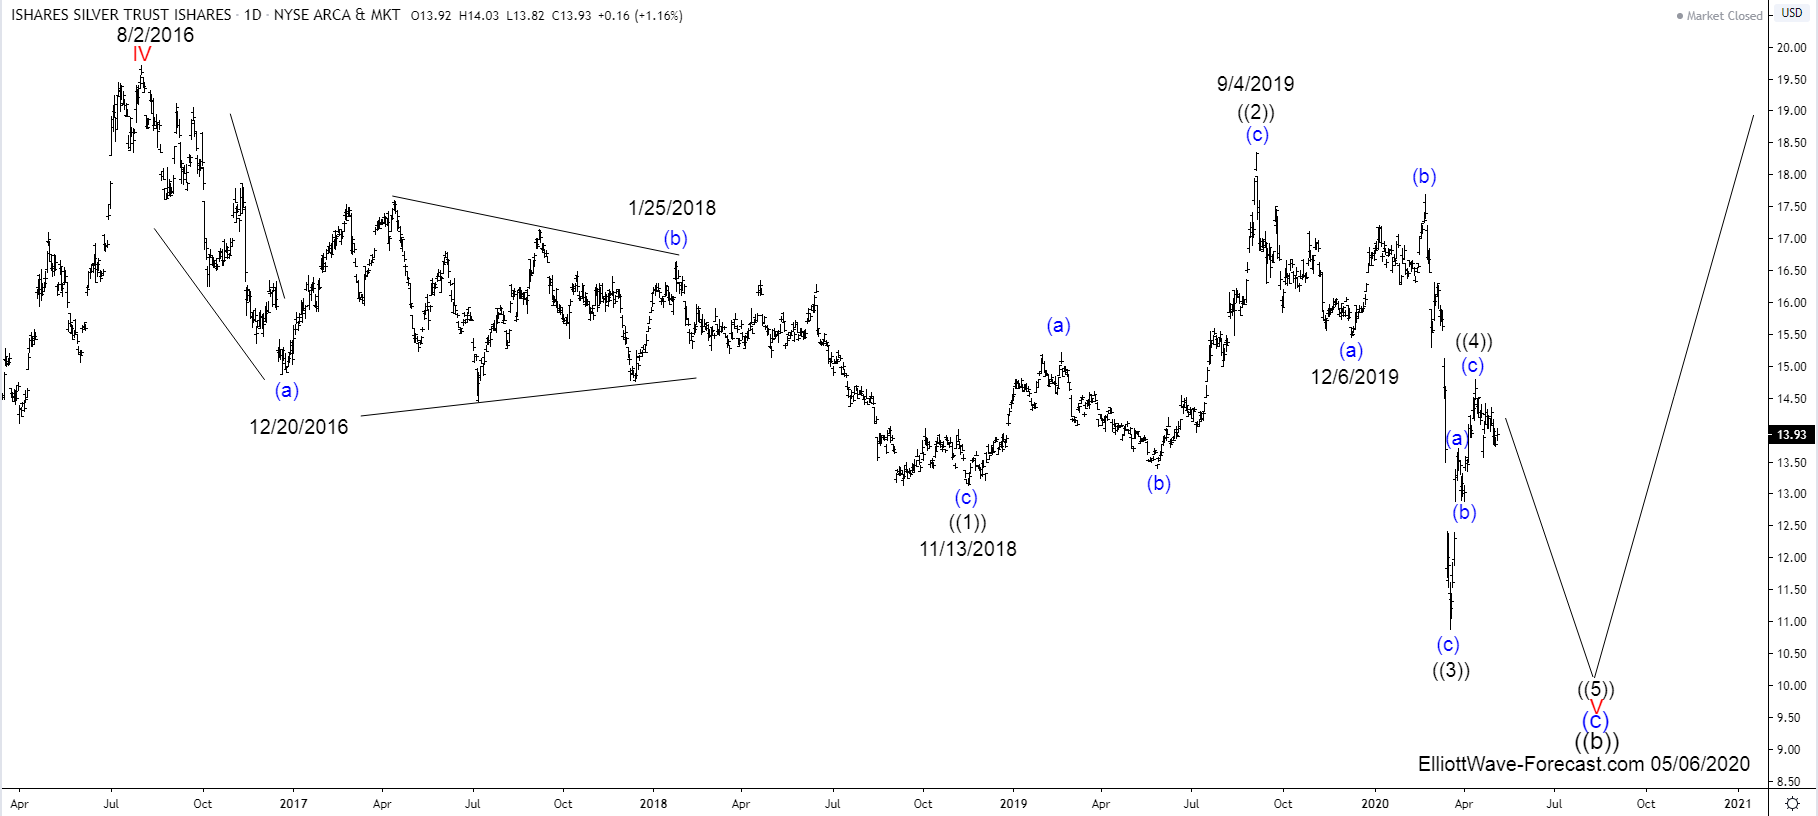
In conclusion, down from the August 2016 highs SLV exhibits all qualities of an Elliott Wave ending diagonal structure. It appears incomplete at this point. It should go lower once more toward the 10.00 to 9.00 area while below the 9/4/2019 highs before a larger degree turn higher.