IBEX 35 is the benchmark Stock Market Index of the Bolsa de Madrid, Spain’s principal stock exchange. Initiated in 1992, the index is administered and calculated by Sociedad de Bolsas, a subsidiary of Bolsas y Mercado Espanoles (BME). BME is the company which runs Spain’s securities markets (including the Bolsa de Madrid). It is a market capitalization-weighted index comprising the 35 most liquid Spanish stocks in the Madrid Stock Exchange General Index.
The Index is very different than the rest of the World Indices. IBEX 35 has never broken above 2007 peak, which is the level before the financial crisis. Thus, the Index can create a floor across the World Indices. At EWF, we have created complimentary technical tools to better utilize Elliott Wave Principle. As we always said, Elliott Wave Theory was developed in 1930. There was no computer in that period nor was there any ability to see and correlate different Markets.
We define a floor as an area in which either an ABC or WXY structure reaches equality in price. We usually show this area in a blue box. The Blue Box area is an inflection area with 100% – 123.6% Fibonacci extension between the first two legs of ABC or WXY Elliott wave structure. Reaching the blue box means that a turn is about to happen. Consequently, it is a warning that market direction may change any moment.
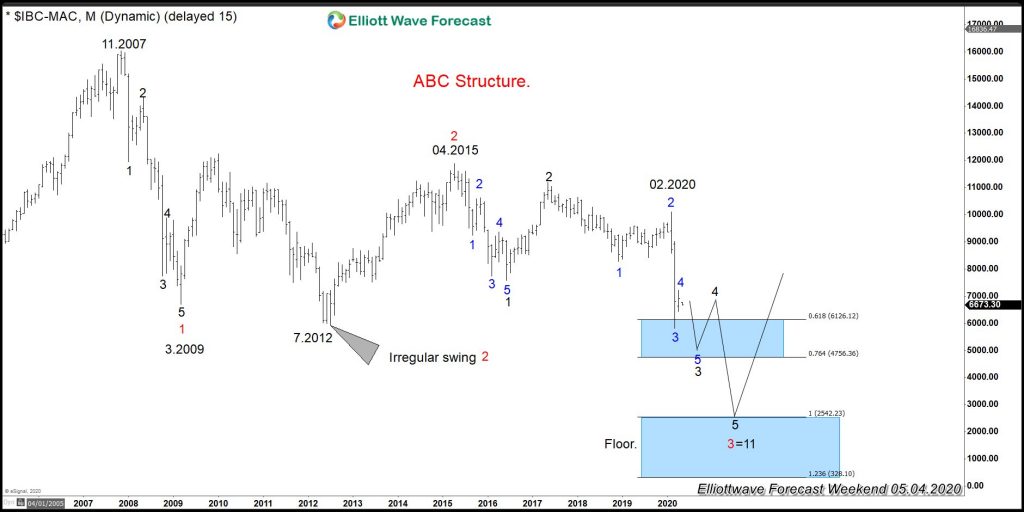
IBEX 35 is one of the few Indices which has not yet broken above 2007 peak. The weekly trend in the Index continues to be either sideways or lower. Earlier this year, the Index took the low at 07.2012. This opens further downside and creates a bearish sequence within the Super cycle degree. Sequence is the natural way that market moves and follows a numerical sequence in each stage. Sequence is either impulse or corrective. Impulse sequence is 5-9-13-17-21-25 whereas corrective sequence is 3-7-11-15-19-23. Both sequences have an increment of 4. Few Elliott wavers use the sequence but we have placed a lot of emphasis in using the sequence at EWF. We believe that without sequence, Elliott Wave Theory can become too subjective. Below is the monthly chart of IBEX:
IBEX Elliott Wave Chart

The chart above shows the sequence in IBEX 35 since 11.2007 high. The initial decline ended at 03.2009 in 5 waves. As we can see, the decline has a label of 12345 in Black , which ends 1 Red in higher degree. The moment it breaks Red 1, it creates a bearish (lower low) sequence,. At that moment, we knew the idea of Indices ending the 2009 cycle was about to happen because IBEX 35 needs to resolve lower. The Index then went forward and developed an irregular flat in swing 2 Red. For general information about Flat structure, the following page Elliott wave Theory explains the rules.
The Index then turned lower at 04.2015 and started the decline to resolve the bearish sequence. Swing 3 in red is now in progress. Subdivision of swing 3 in red needs to be in five swings in black as swing 1 in red was also in five swings in black. At this moment, we can see swing 1 in black completed in five swing in blues, which is the lesser degree. Swing 3 in black is in progress, which needs another swing 5 in blue to complete. Afterwards, a bounce in swing 4 in black should happen before turning lower again. The target is the 100% – 123.6% fibonacci extension of the red 1 and 2 which is denoted in the blue box. This should end swing 3 in red as well as swing eleven in black.
The idea and sequence of IBEX 35 are telling the whole world that choppiness will stay here for a while. But the idea that we need a series of 4-5 to end red 3 means that every dip will find buyers and creates a bounce until IBEX reaches the ideal floor at 2542.23 area. Not every Index needs to follow the same Elliott Wave structure. Some indices might do a WXY from the peak at 02.2020, and some might do a triangle. However, acceleration to the upside will not happen until IBEX 35 reaches the blue box and ends the bearish sequence. In the end, it is one market only.

