
Barrick Gold Corporation (NYSE: GOLD) is the second-largest gold mining company in the world. Year-to-Date, the stock is up around 45%. The combination of low Oil’s price (major cost component for miners) and high price in gold creates a favorable environment for the company. On Wednesday, the company will report its first-quarter results. The consensus for the EPS is at 16 cents, compared to 11 cents in first quarter last year. Reveenue is projected at $2.8 billion, a 32.5% increase year-on-year basis.
In Mid April, the company provides preliminary estimates. The company announced it sold 1.2 million ounces in the first quarter and the CEO Mark Bristow affirms the company will achieve the guidance for the year despite the Covid-19 pandemic and lockdowns. Ever since the merger with Randgold Resources in early 2019, the stock has rallied nicely. The company has been able to reduce the debt load and increase free cash flow from $365 million to $1.1 billion.
Barrick (GOLD) Weekly Elliott Wave Chart
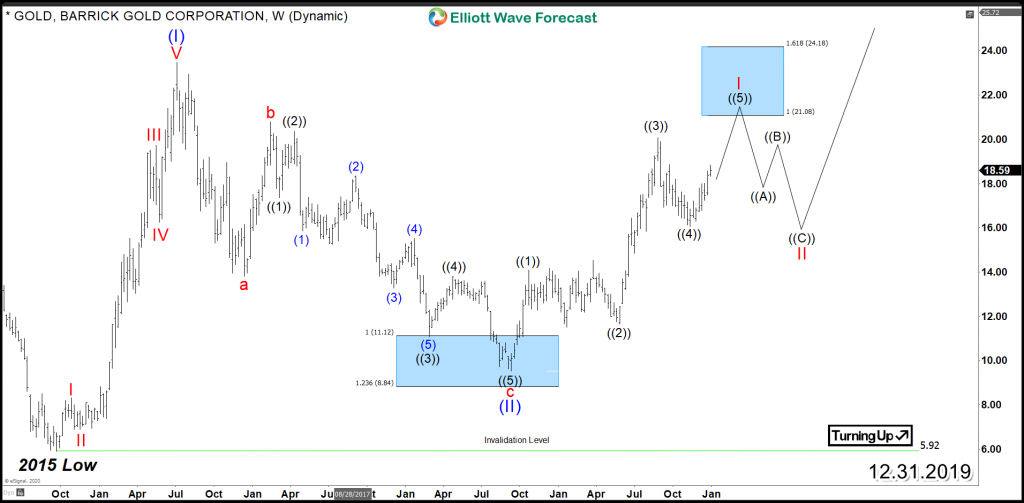
The above chart is our forecast from December 31, 2019. Last year, we projected Barrick (GOLD) to resume higher as an impulse and eventually break above wave (I) at 2016 high. Fast forward to May 2020, the stock finally managed to break above 2016 high. It did a sharp but brief selloff in the wave II pullback as a result of the Covid-19 selloff. Below is the chart update for the stock.
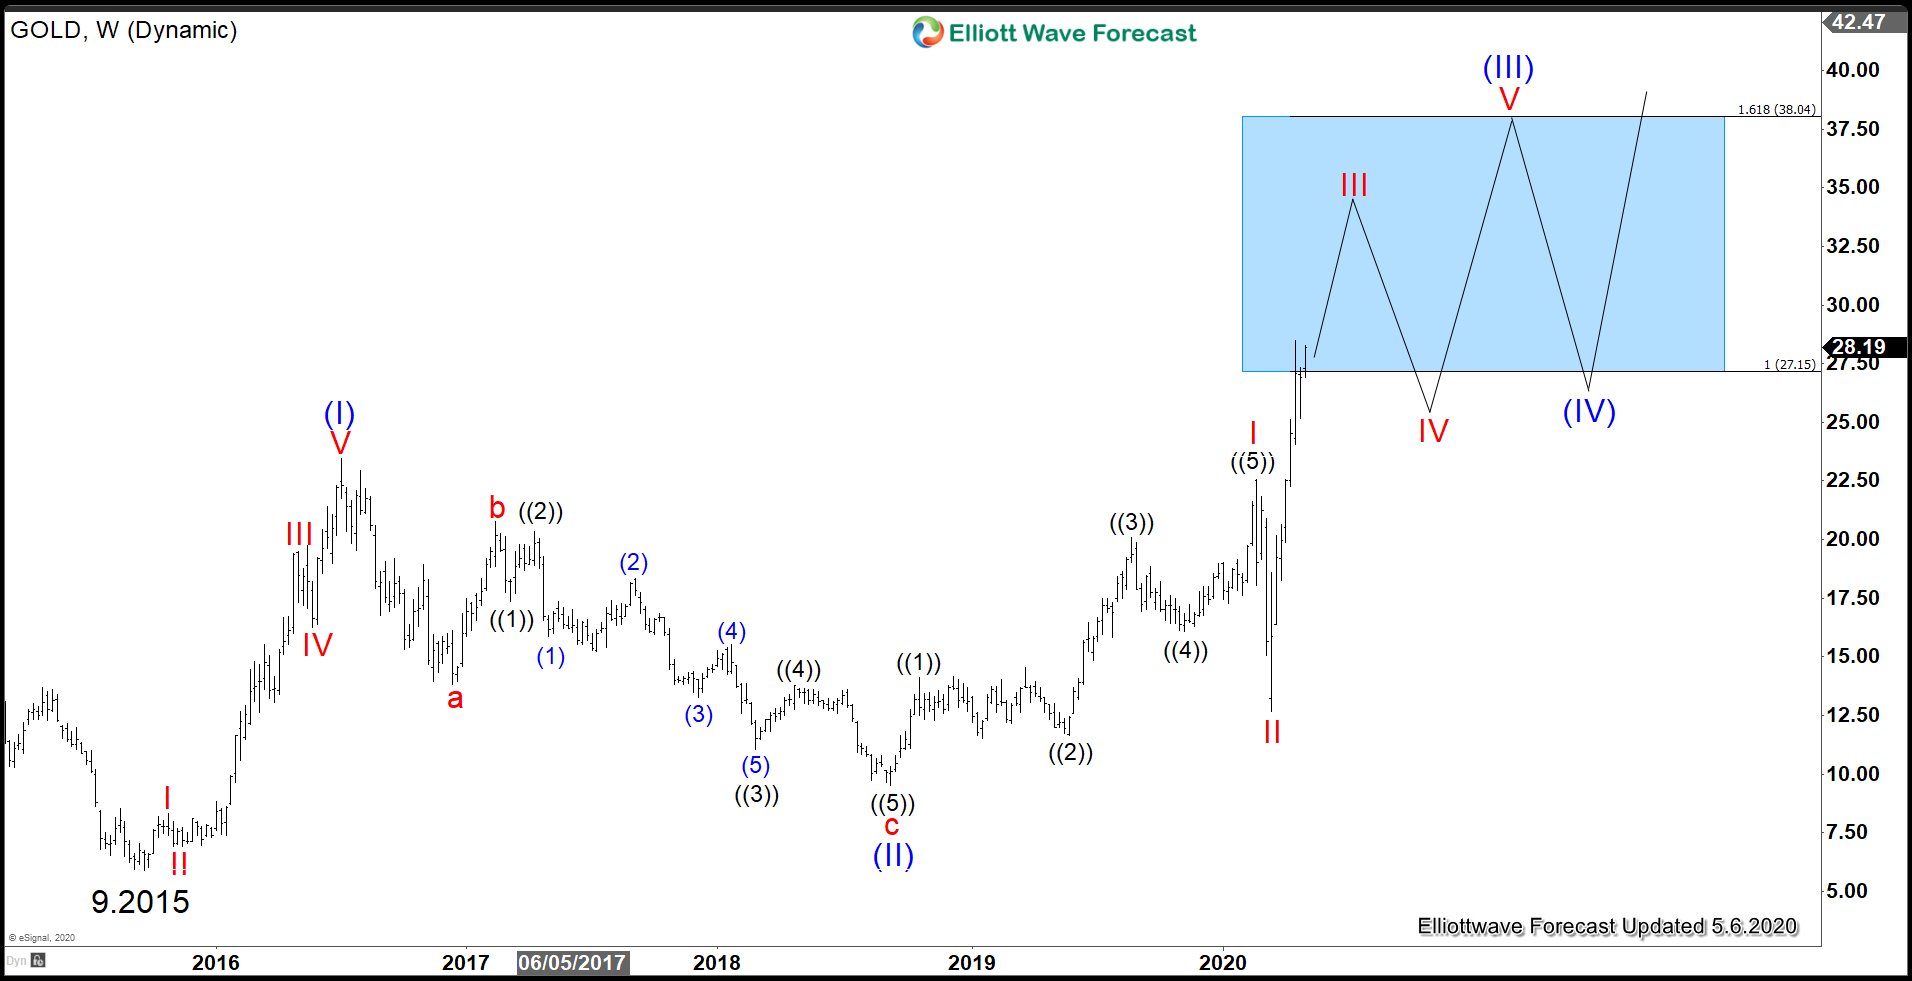
The rally from September 2015 low is unfolding as a 5 waves impulse Elliott Wave structure. The stock is currently within wave III of (III) and should continue to see further upside. A 161.8% fibonacci extension from September 2015 low is $38, which is a potential target to end wave (III). The stock looks to remain favorable in coming months and years and pullback should continue to find support in 3, 7, or 11 swing.