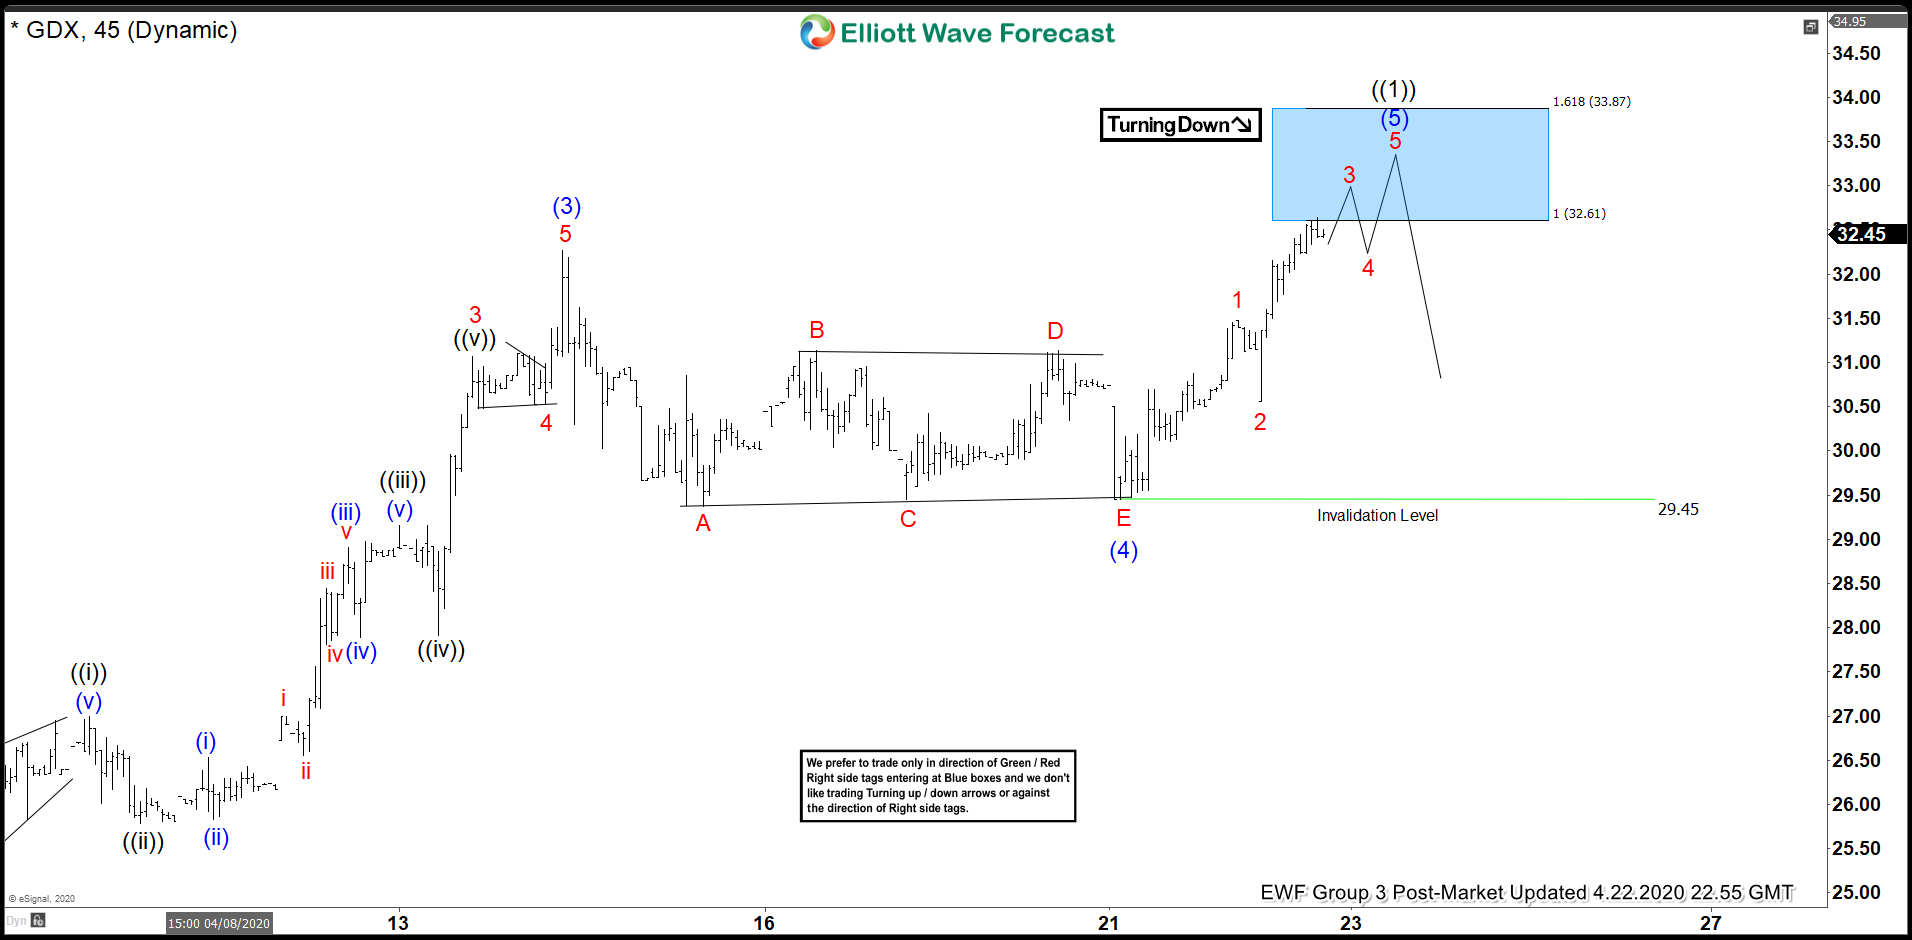
Elliott Wave view in Gold Miners ETF (GDX) suggests the rally from March 16, 2020 low is unfolding as a 5 waves impulsive structure. Up from March 16 low, wave (1) ended at 27.21 and pullback in wave (2) ended at 23. The ETF then extends higher in wave (3) towards 32.27 and wave (4) pullback ended at 29.37. The 45 minutes chart below shows the internal of wave (3) which unfolded as another impulse of lesser degree.
Wave (4) correction ended as a triangle. Wave A ended at 29.37, wave B at 31.12, wave C at 29.45, wave D at 31.13, and wave E of (4) ended at 29.45. The instrument then extends higher again in wave (5) with potential to end at 32.61 – 33.87 (blue box). This move will also complete wave ((1)) and thus ends cycle from March 16, 2020 low. Afterwards, the instrument can see larger pullback within wave ((2)) to correct cycle from March 16, 2020 low in 3, 7, or 11 swing before turning higher again.
We don’t like selling the instrument and GDX can always extend higher as the structure is in 5 waves. Furthermore, the sequence from January 2016 low appears incomplete with 100% – 123.6% Fibonacci target towards 36 – 40.6.
GDX 45 Minutes Elliott Wave Chart