Short Term Elliott Wave View suggests rally in Amazon (Ticker: AMZN) from March 26 low is unfolding as a 5 waves impulse Elliott Wave structure. Up from March 26 low, wave (1) ended at 1993.02 high. The pullback in wave (2) ended at 1889.15 low. From there, the stock has resumed higher and has broken above previous wave (1) high. Wave 1 ended at 2059.54 high. The structure of wave 1 is unfolding as another impulsive structure in lesser degree.
Up from April 4 wave (2) low, wave ((i)) ended at 1965.69 high and pullback in wave ((ii)) ended at 1930.02 low. Wave ((iii)) ended at 2035.72 high and wave ((iv)) pullback ended at 1997.62 low. Afterwards, Amazon pushed higher and ended wave ((v)) at 2059.54 high. The pullback in wave 2 then ended at 2017.98 low. Up from there, Amazon ended wave ((i)) at 2050 high and the pullback in wave ((ii)) ended at 2033 low. The stock continued to extend higher and broke above previous wave 1 high to create higher high. Currently, wave ((iii)) is still in progress. Near term, while dips stay above April 9 wave 2 low (2017.98), expect Amazon to resume higher for a few more highs to end wave 3. Pullback in wave 4 should follow soon after before it resumes upside.
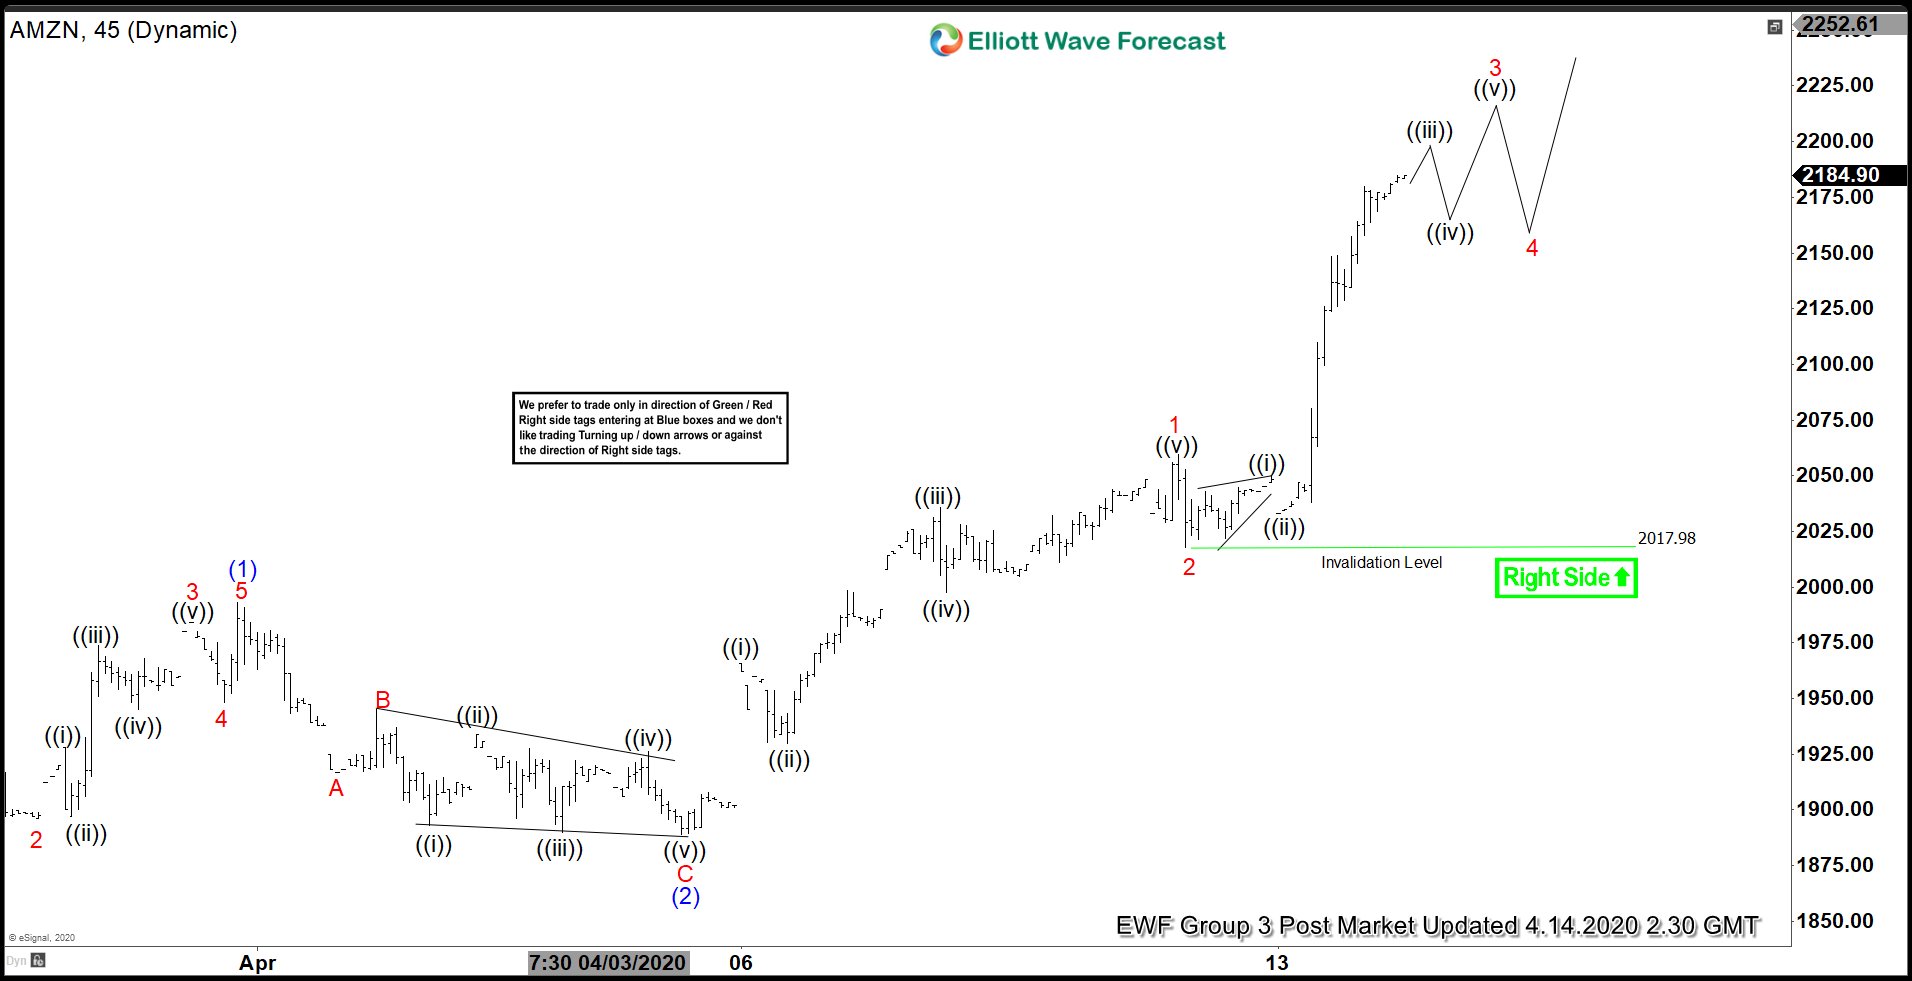
AMZN 1 Hour Elliott Wave Chart