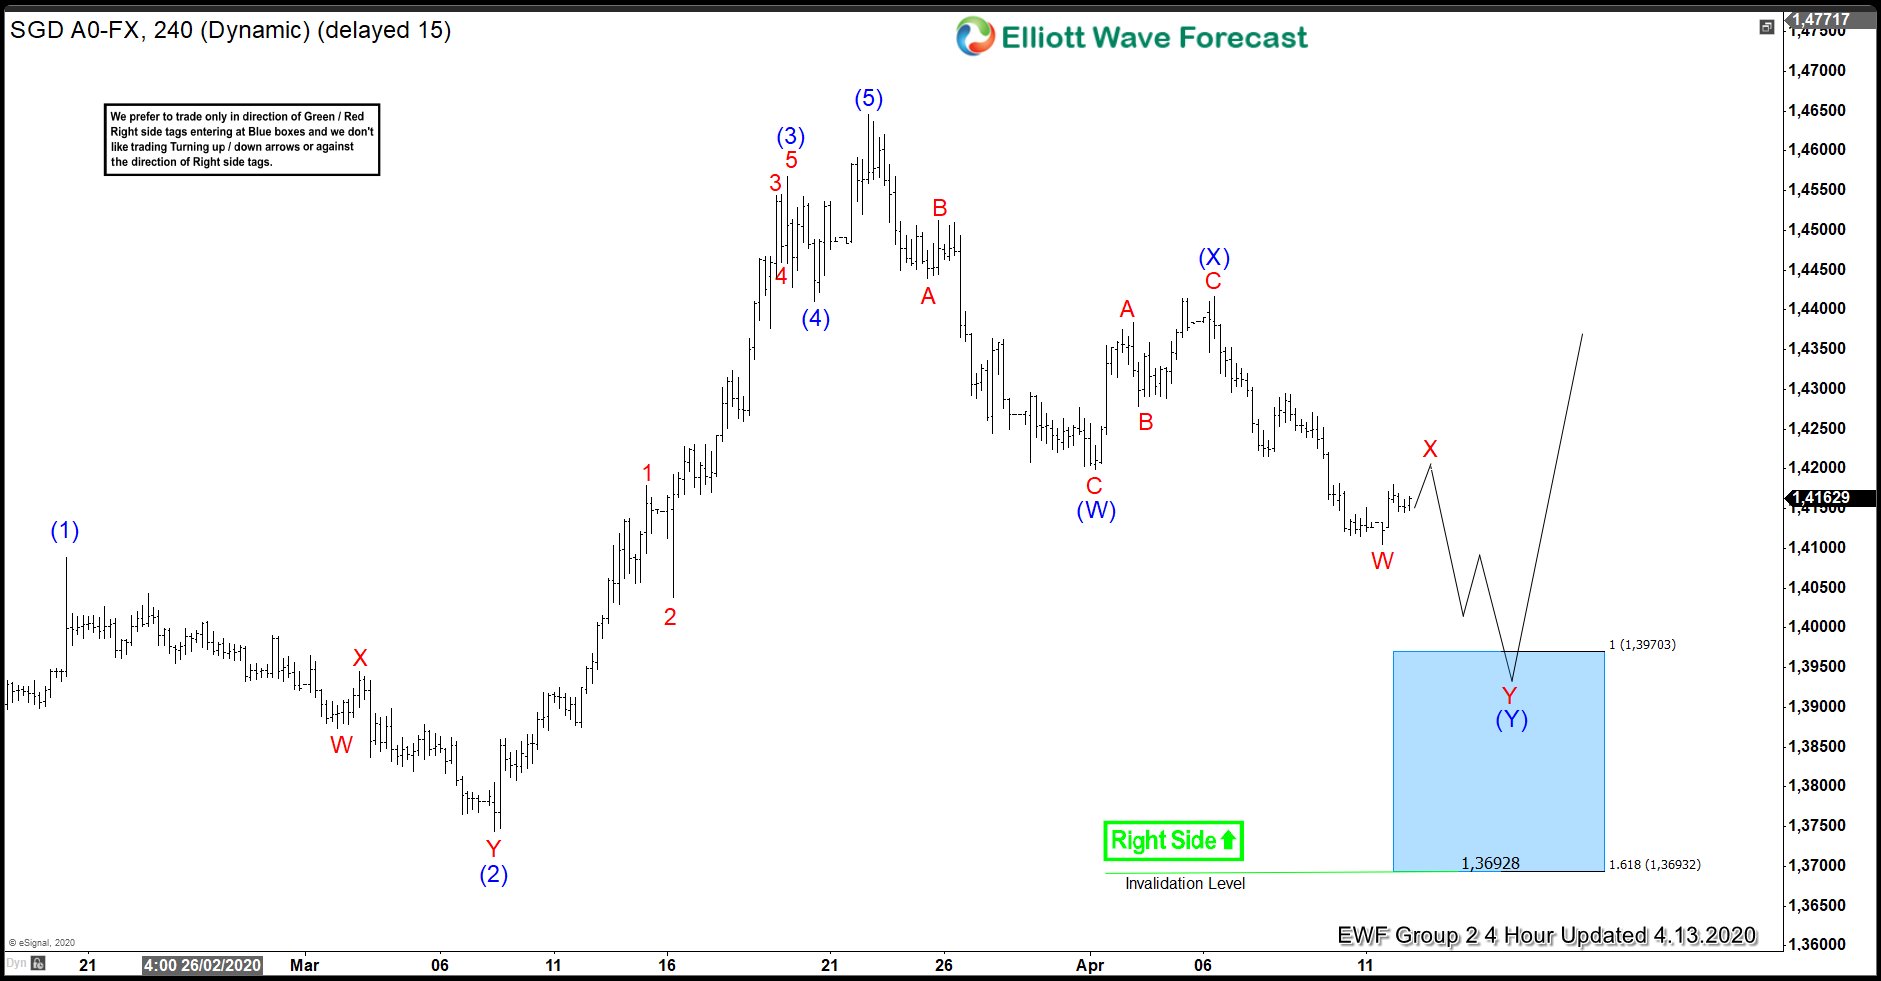
In this blog, we are going to take a look at the Elliott Wave chart of USDSGD. The 4 hour chart update from April 13, 2020 shows that 5 waves impulsive structure has ended on March 23, 2020. The rally ended at 1.4646 high. Based on Elliott Wave theory, a 3 waves pullback should happen before the rally to the upside can resume again.
The cycle from March 23, 2020 high is unfolding as double three correction. The pair has broken below wave (W) low to confirm that the next leg lower has started. Wave (W) ended at 1.4198 low. Meanwhile, the bounce in wave (X) ended at 1.4416 high. From there, the pair has resumed lower. The 100% extension of wave (W)-(X) where wave (Y) can potentially end is at 1.3693-1.3970 area. This area is shown with a blue box on the chart. As long as 1.618 extension at 1.3693 stays intact, buyers should start to appear at the blue box area. From there, the pair can see 3 waves bounce at least or an extension higher.
USDSGD 4.13.2020 4 Hour Elliott Wave Update
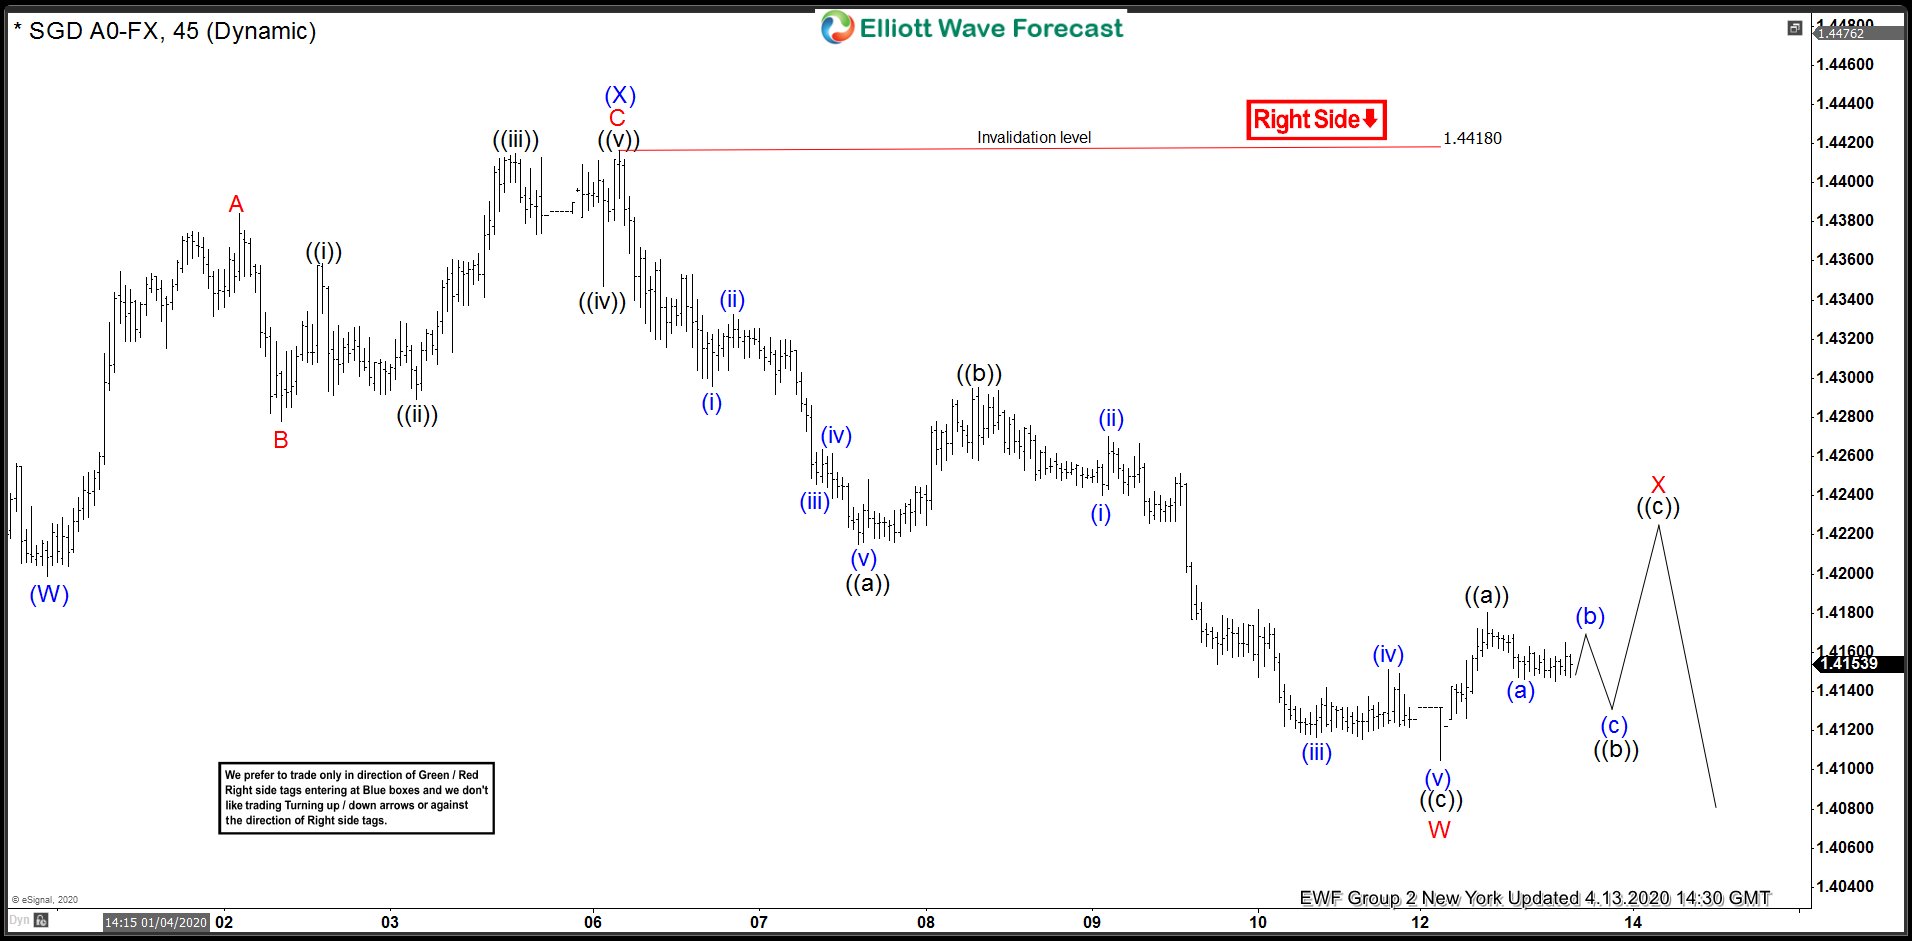
Near term, 1 hour chart from April 13, 2020 New York update shows that the pair has ended wave W at 1.4105 low. Right now, the pair is doing a bounce in wave X. While below 1.4418 high, expect the bounce in 3,7, or 11 swing to fail. Afterwards, the pair may continue to extend lower towards the equal leg blue box area shown in the previous 4 hour chart update.
USDSGD 4.13.2020 1 Hour New York Elliott Wave Update