In recent days, the dutch stock Heineken has attracted a reasonable public attention as it also owns the Mort subite brand. In popular culture, the beer Mort subite goes with the Corona beer. “For 2x Coronas one can obtain 1x Mort Subite (sudden death, cardiac arrest) for free”. From the February 2020, the Heineken stock has experienced a sharp drop. Disregarding any fundamentals, which may have caused that development, here, I take a technical look on the price chart of Heineken stock.
Heineken Weekly Elliott Wave Analysis 03.15.2020
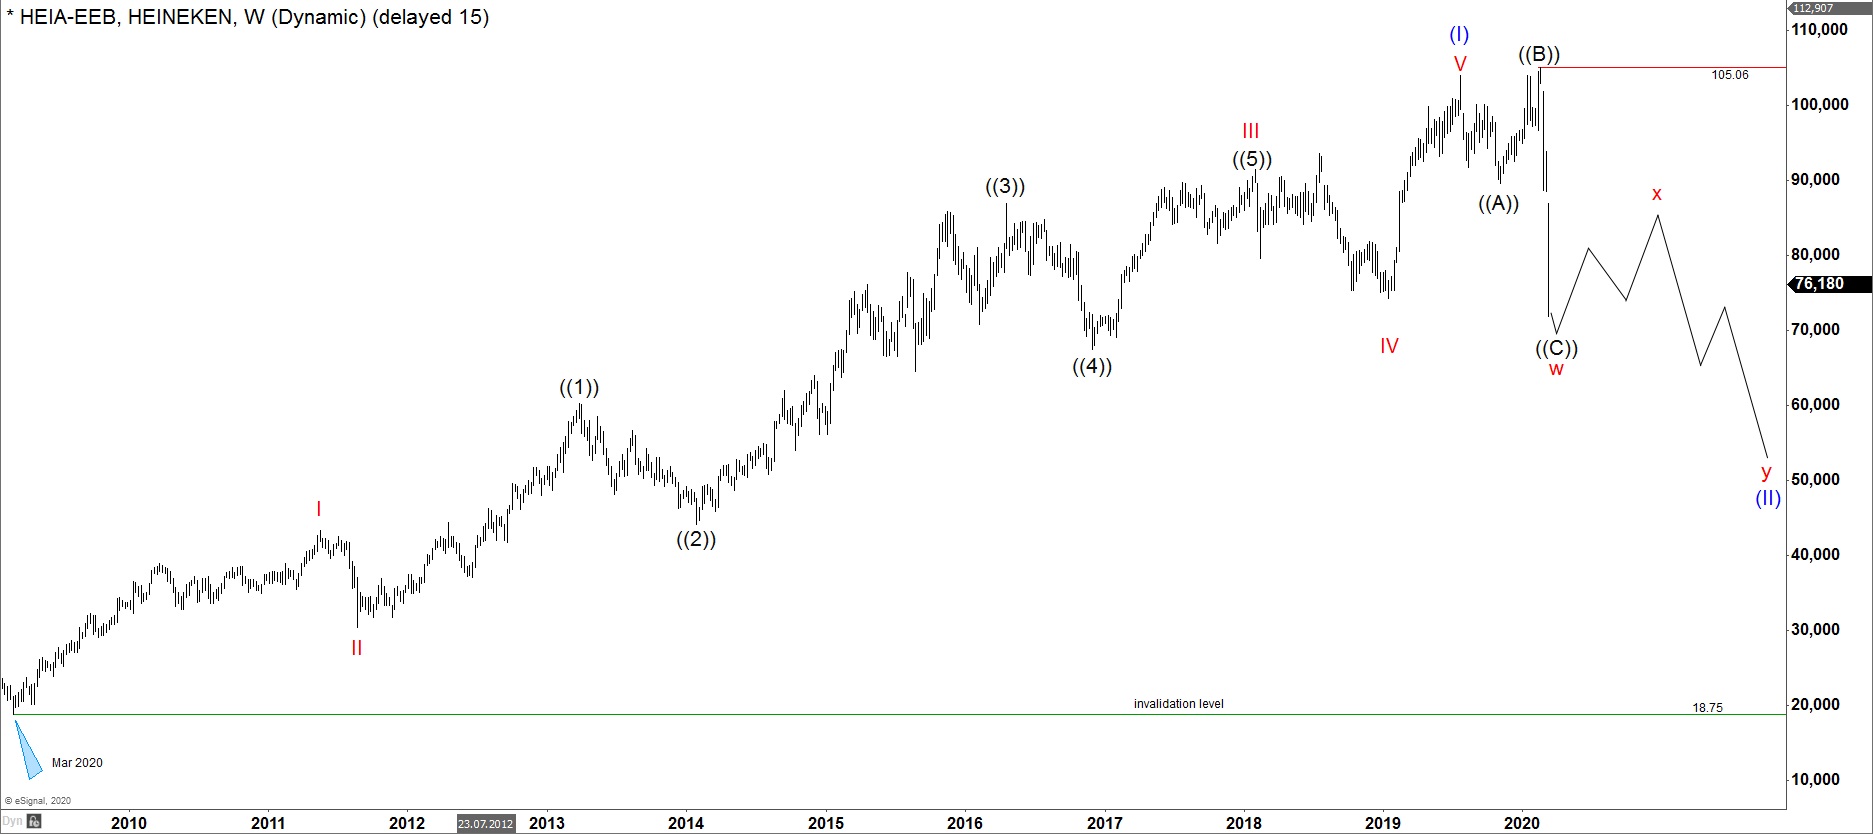
In weekly time frame, the stock has ended a cycle up from the March 2009 lows to the July 2019 highs at 104.08. The 9 swings up and the internal structure of the rally strongly suggests an impulsive character of the cycle. We denote it as a blue wave (I) of a super cycle degree. From the July 2019 highs 3 swings lower have ended the black wave ((A)). From there, we saw a 3 waves bounce to a marginal new high in black wave ((B)) on February 2020 at 105.06. Therafter, a sharp decline in wave ((C)) has brought the prices lower towards 71.86.
The corrective pattern may be an expanded flat demonstrating the right extensions. The entire decline from the July 2019 has reached at 71.86 a resonable depth of correction. Therefore, technically the cycle lower in blue wave ((II)) to correct the cycle up in blue wave (I) might be over. While pullbacks remain above 71.86, the stock may resume the rally in another swing higher.
Heineken Weekly Outlook
Global markets behavior and the cycles period ratio for Heieneken favor a more bearish outlook. In fact, the correction has taken only half a year in comparison to a 10-year long cycle up. Therefore, Heineken can go sideways to lower together with other major indices in the coming months. The flat pattern can be seen as the first leg lower in a red wave w. While above 71.86, the stock price may see a bounce higher to provide a connector wave x in red. From there, while below 104-105 area, it can extend lower in another leg down as a red wave y to finish the blue wave ((II)). If the double correction pattern towards 60-50 area will take place, we prefer buying from these extremes. From there, Heineken should resume the rally or produce a 3 waves bounce at least.
Aternatively, the price may oscillate between the extreme areas being 71.86 and 105.06 to accomplish a triangle pattern. Once finished, it can resolve to the upside in a thrust move. Hereby, the correction cannot be a wave (II) of an impulse but would become rather a (b) wave of a zigzag. Ultimatively, expect Heineken to extend in at least another swing higher.