
Hello fellow traders. In this technical blog we’re going to take a quick look at the Elliott Wave charts of INDU ( $YM_F) , published in members area of the website. As our members know , recently we were calling for more weakness in INDU within the cycle from the February 12th peak. Eventually INDU broke 02/28 low confirming further weakness. Consequently, we advised members to avoid buying the index and keep on favoring the short side. In further text we’re going to explain Elliott Wave Forecast.
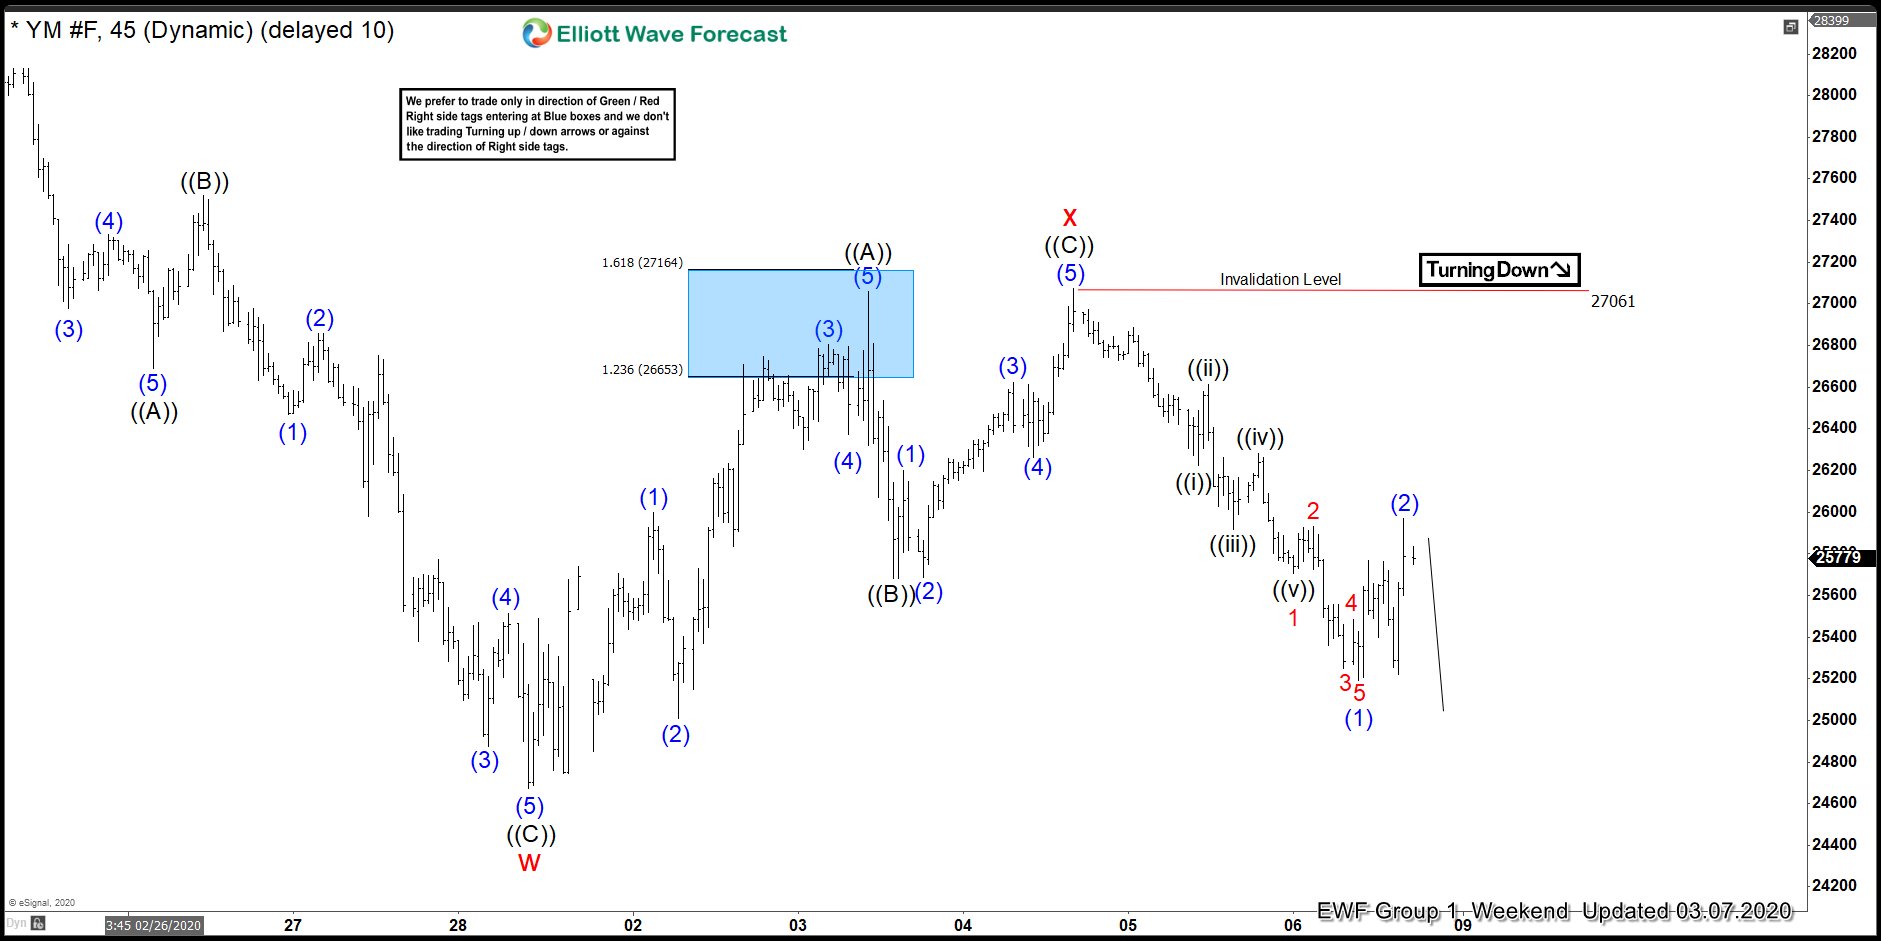
INDU 1 Hour Elliott Wave Analysis 03.07.2020
Current view suggests the cycle from the February 12th peak remains in progress. First leg from the mentioned high unfolded as Elliott Wave Zig Zag pattern. X red connector also has the for of Zig Zag, when it ended as truncation at the 27061 peak. As far as the price stays below that level, INDU should be ideally trading lower within Y red wave. However we need to see break below W red – 02/28 low in order to confirm next leg down is in progress.
You can learn more about Elliott Wave Zig Zag Patterns at our Free Elliott Wave Educational Web Page.
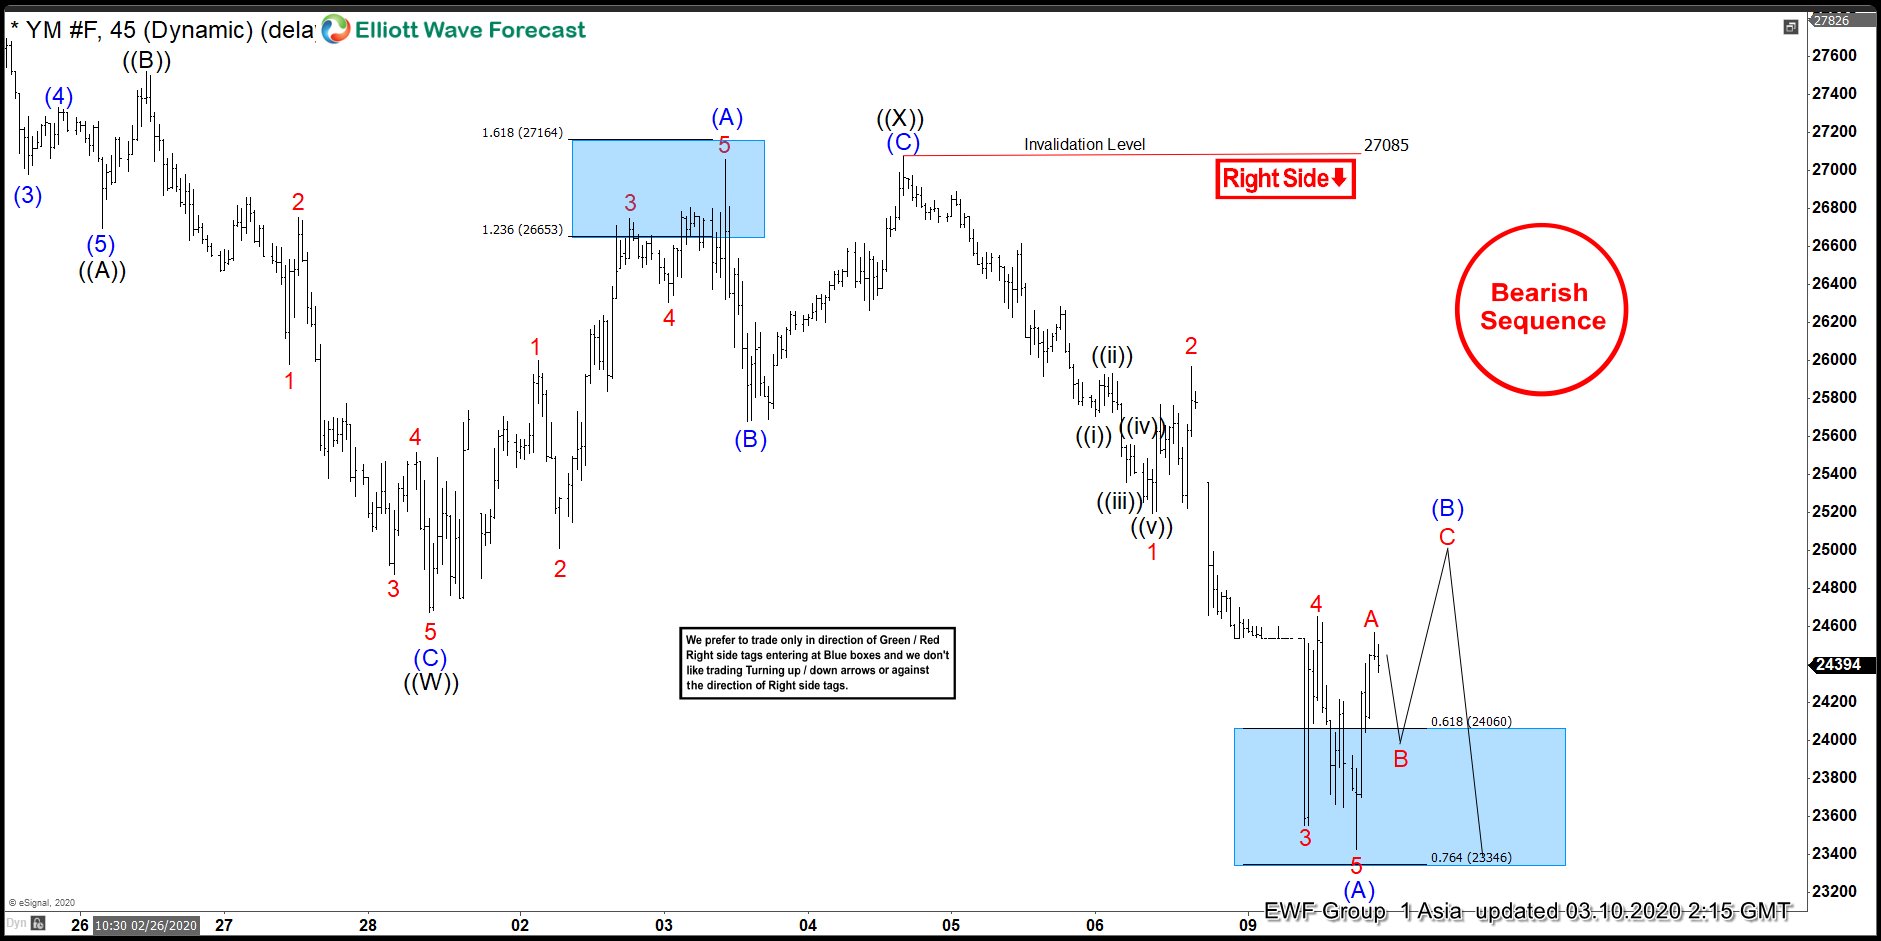
INDU 1 Hour Elliott Wave Analysis 03.10.2020
Eventually INDU broke 02/28 low and confirmed next leg down is in progress. The index is now bearish against the 27085 peak, targeting 22211 area. The price has ended first leg down from the 27085 peak as 5 waves structure. Currently we are getting bounce from the 0.618-0.764 fib extension: 24060-23346 area. At this moment recovery looks incomplete. It seems like we got only first leg so far. We’re calling for short term pull back in B red, and then another leg up C of (B) . Once (B) blue completes as clear 3 waves , more downside should follow toward mentioned target area.
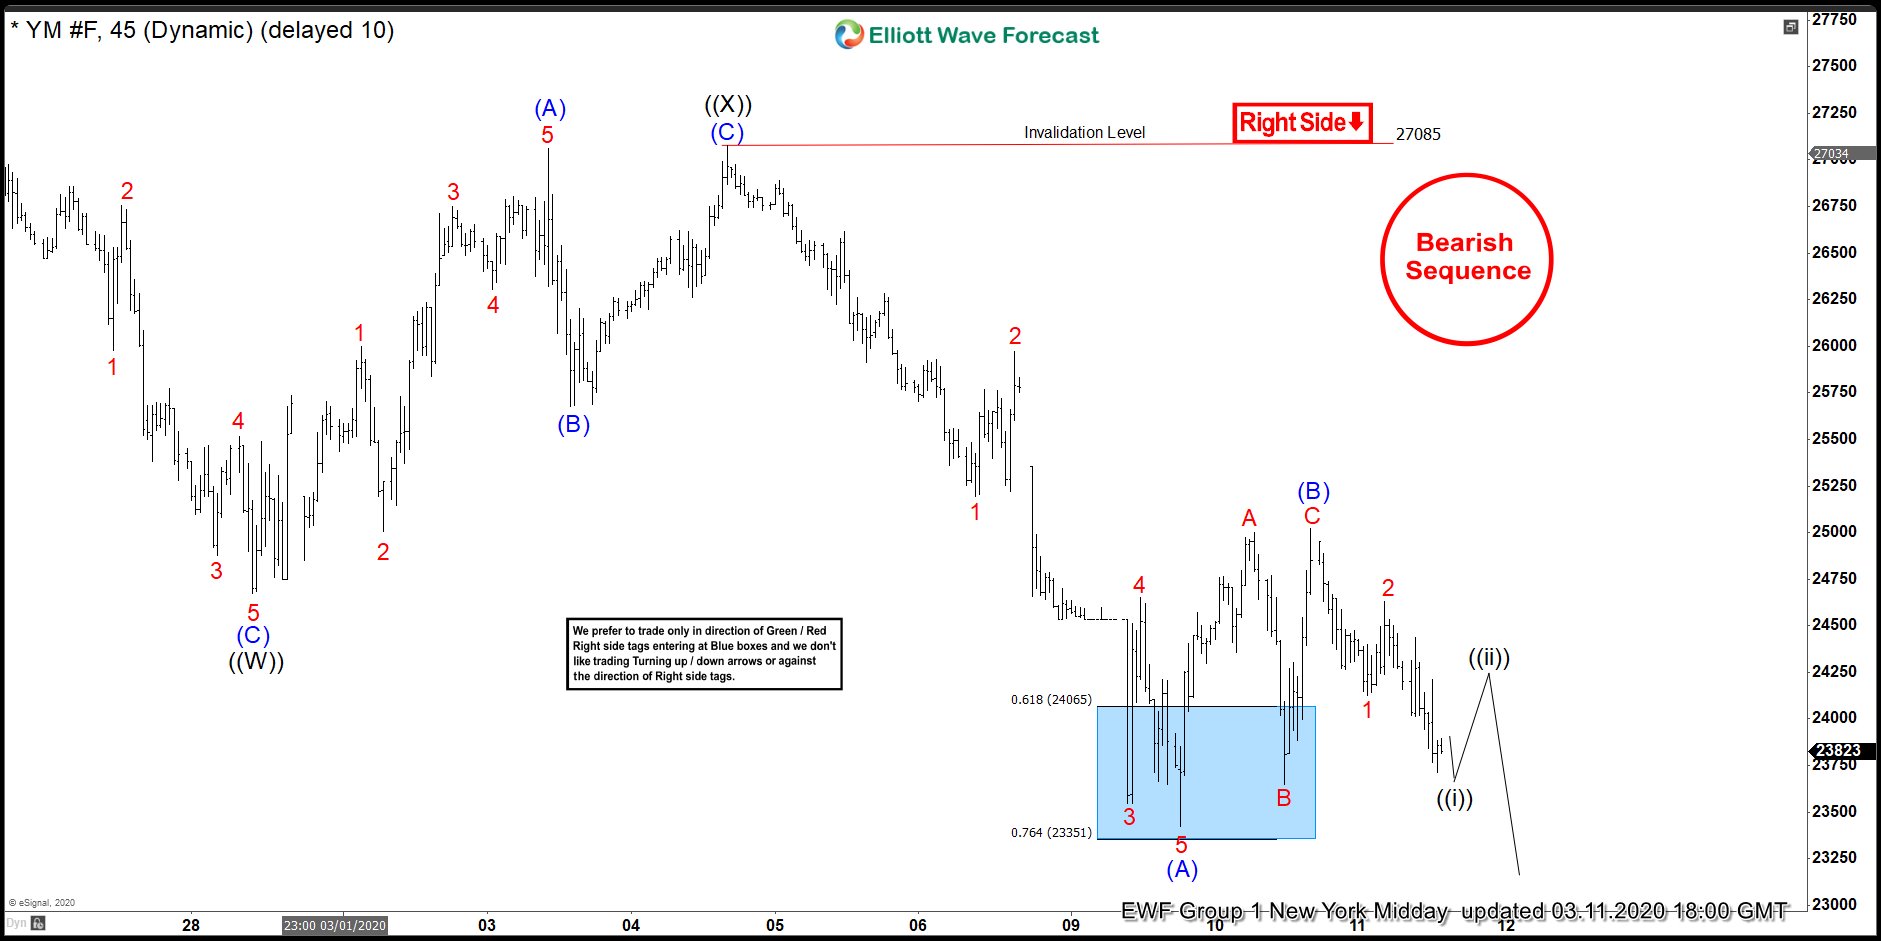
INDU 1 Hour Elliott Wave Analysis 03.11.2020
INDU gave us 3 waves bounce in wave (B) as expected. Recovery is counted completed at 25020 high. Now we are looking for more weakness toward our target : 22211 area. We need to see break below (A) blue-03.10 low to confirm next leg down is in progress.
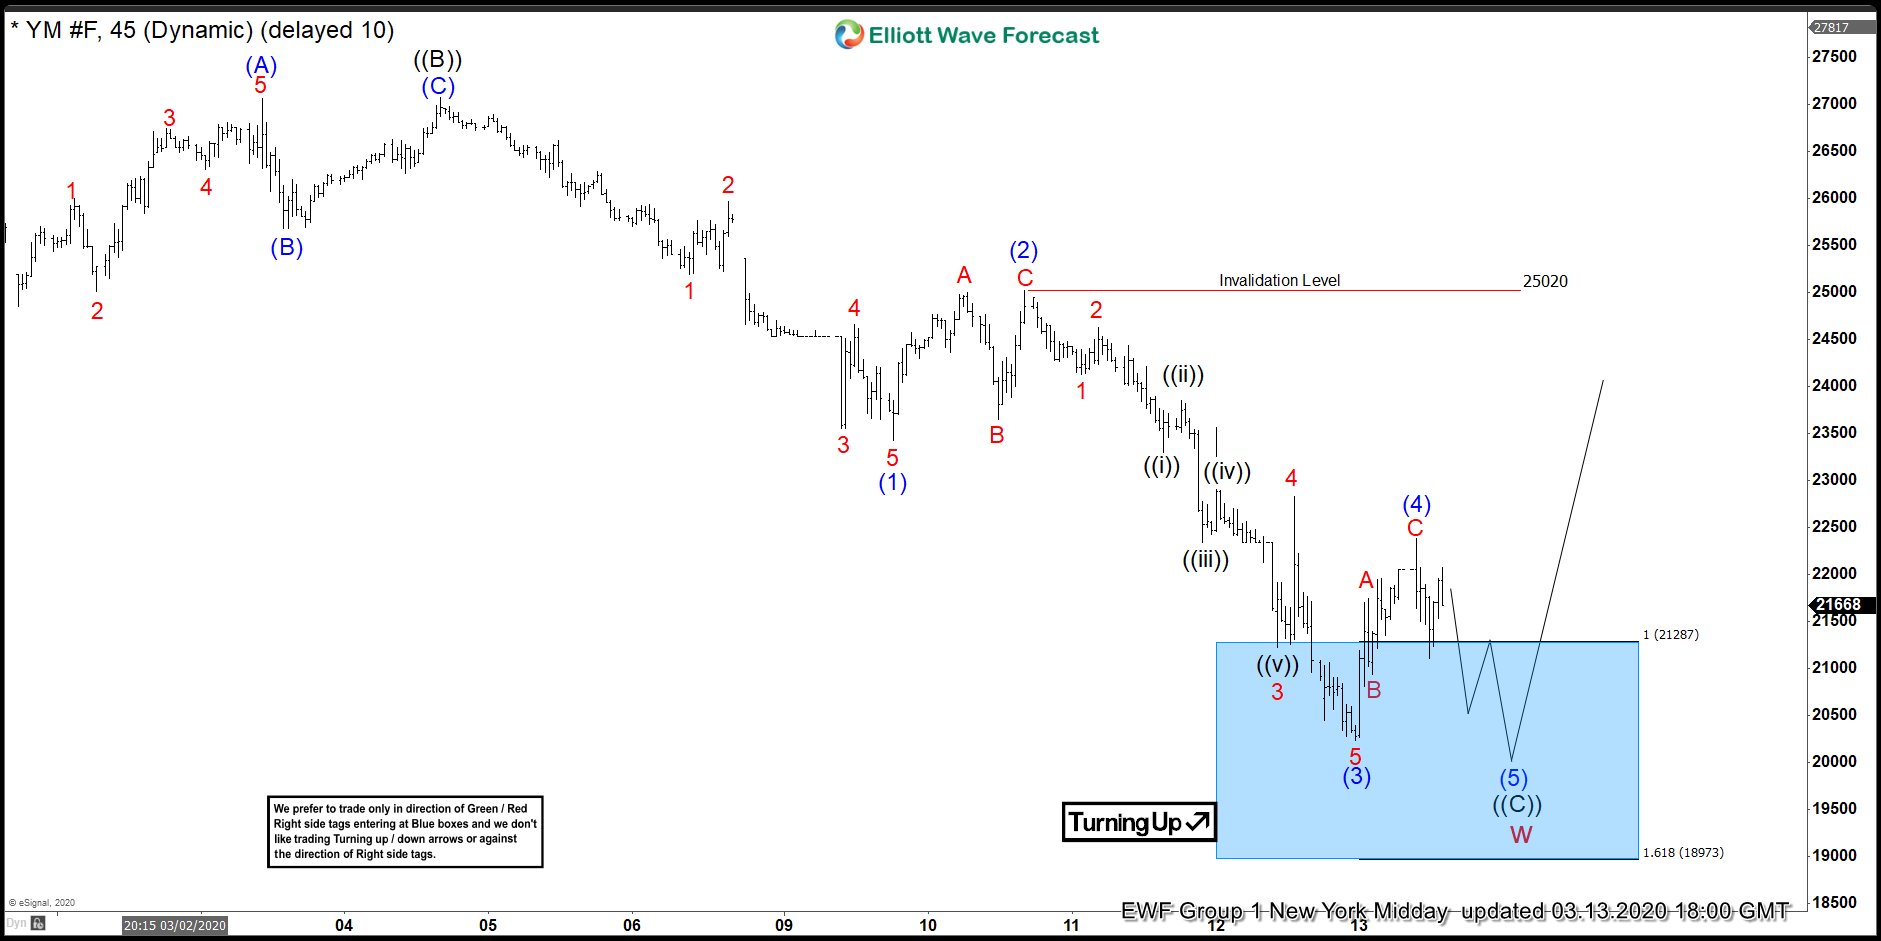
INDU 1 Hour Elliott Wave Analysis 03.13.2020
Eventually the price has reached proposed target: equal legs from the 02/12 peak at 22211. Short term equal legs from the March 4th peak is also reached at 21287-18973. However at the moment there is no yet clear sign that February 12th is done. As far as short term pivot at 25020 holds, another short term low still can be seen within bonus time. Anyway we should keep in mind INDU already reached 100% ext in February cycle, so minimum requirements are there and selling is not recommended at this stage.
Keep in mind Market is dynamic and presented view could have changed in the mean time. Not every chart is trading recommendation. Best instruments to trade are those having incomplete bullish or bearish swings sequences.We put them in Sequence Report and best among them are shown in the Live Trading Room.
Elliott Wave Forecast