In this technical blog, we are going to take a look at the past performance of XLE 1-Hour Elliott wave Charts that we presented to our members. In which, the decline from 4/23/2019 peak took place as an impulse Elliott wave structure with right side tag pointing lower called for more downside. Therefore, our members knew that selling the bounces into the direction of the right side tag remained the preferred path. We will explain the Elliott wave structure & selling opportunity our members took below:
XLE 1 Hour Elliott Wave Chart
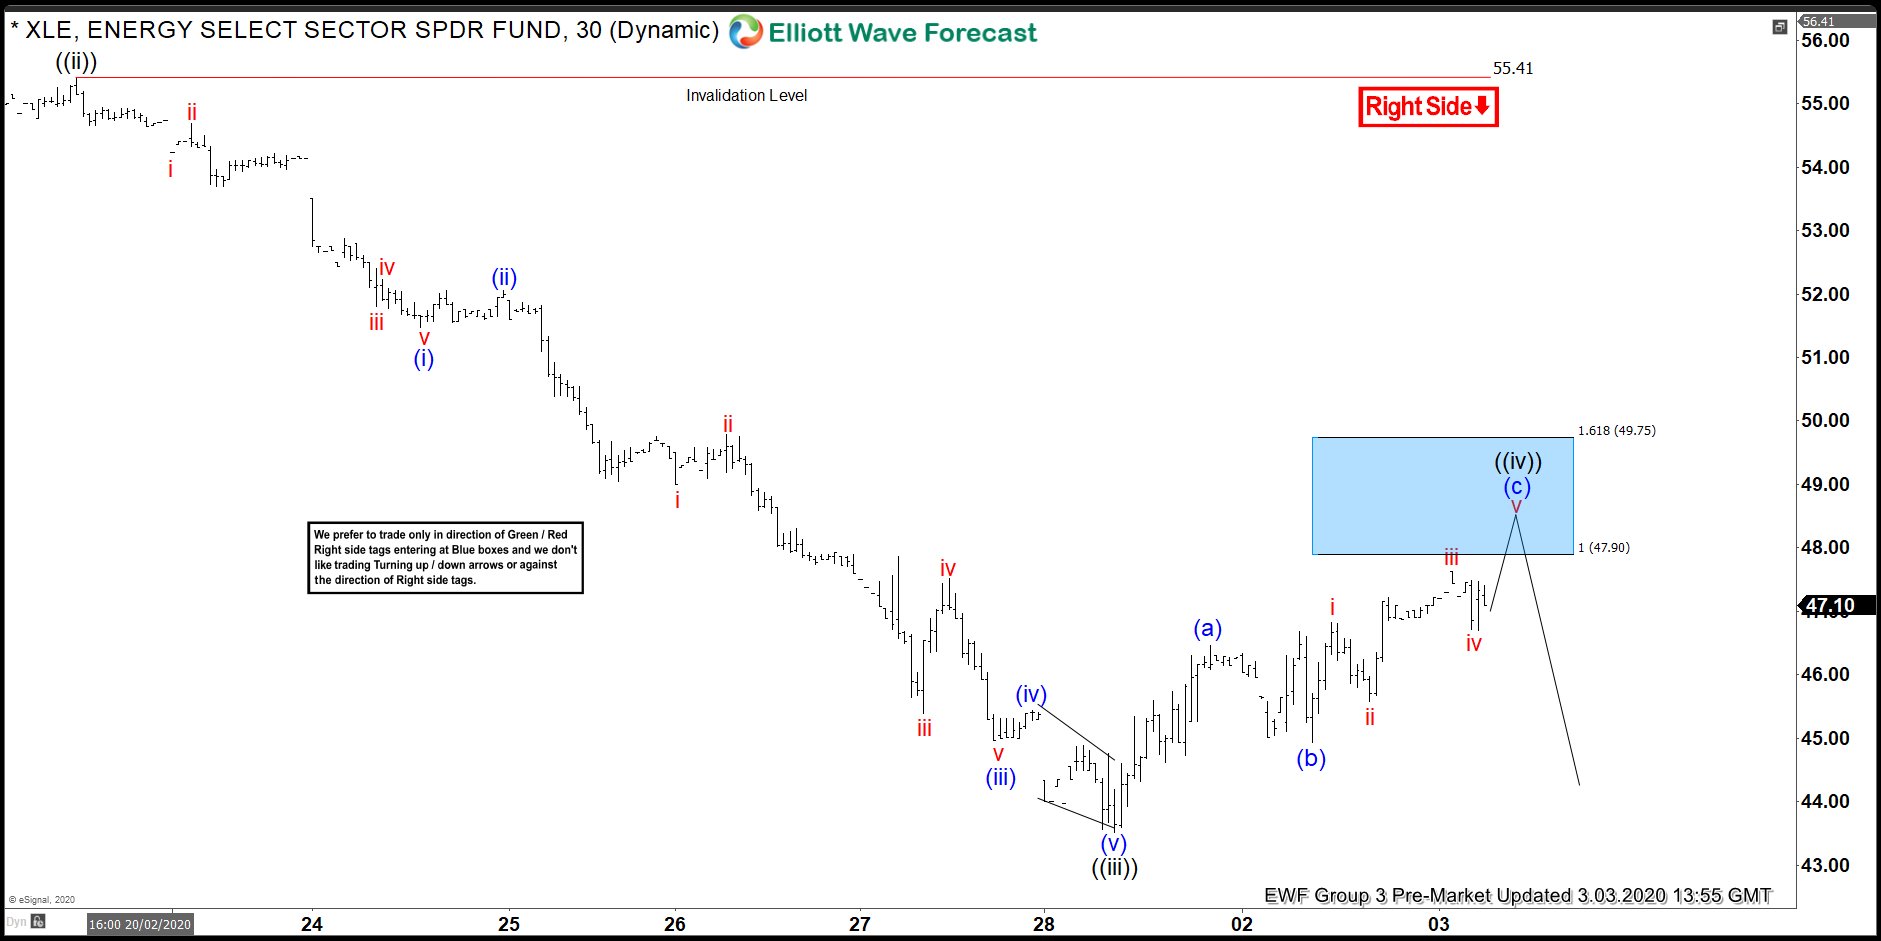
XLE 1 Hour Elliott Wave Chart from 3/03/2020 Pre-Market update. In which the decline unfolded as an impulse structure where wave ((i)) ended at $52.55 low. Wave ((ii)) ended at $55.41 high, wave ((iii)) ended at $43.52 low and does a wave ((iv)) bounce. The internals of that bounce unfolded as Elliott wave zigzag structure where lesser degree wave (a) ended at $46.46. Wave (b) ended at $44.93 and wave (c) was expected to reach $47.90-$49.75 100%-161.8% Fibonacci extension area of (a)-(b). From where sellers were expected to appear looking for more downside.
XLE 1 Hour Elliott Wave Chart
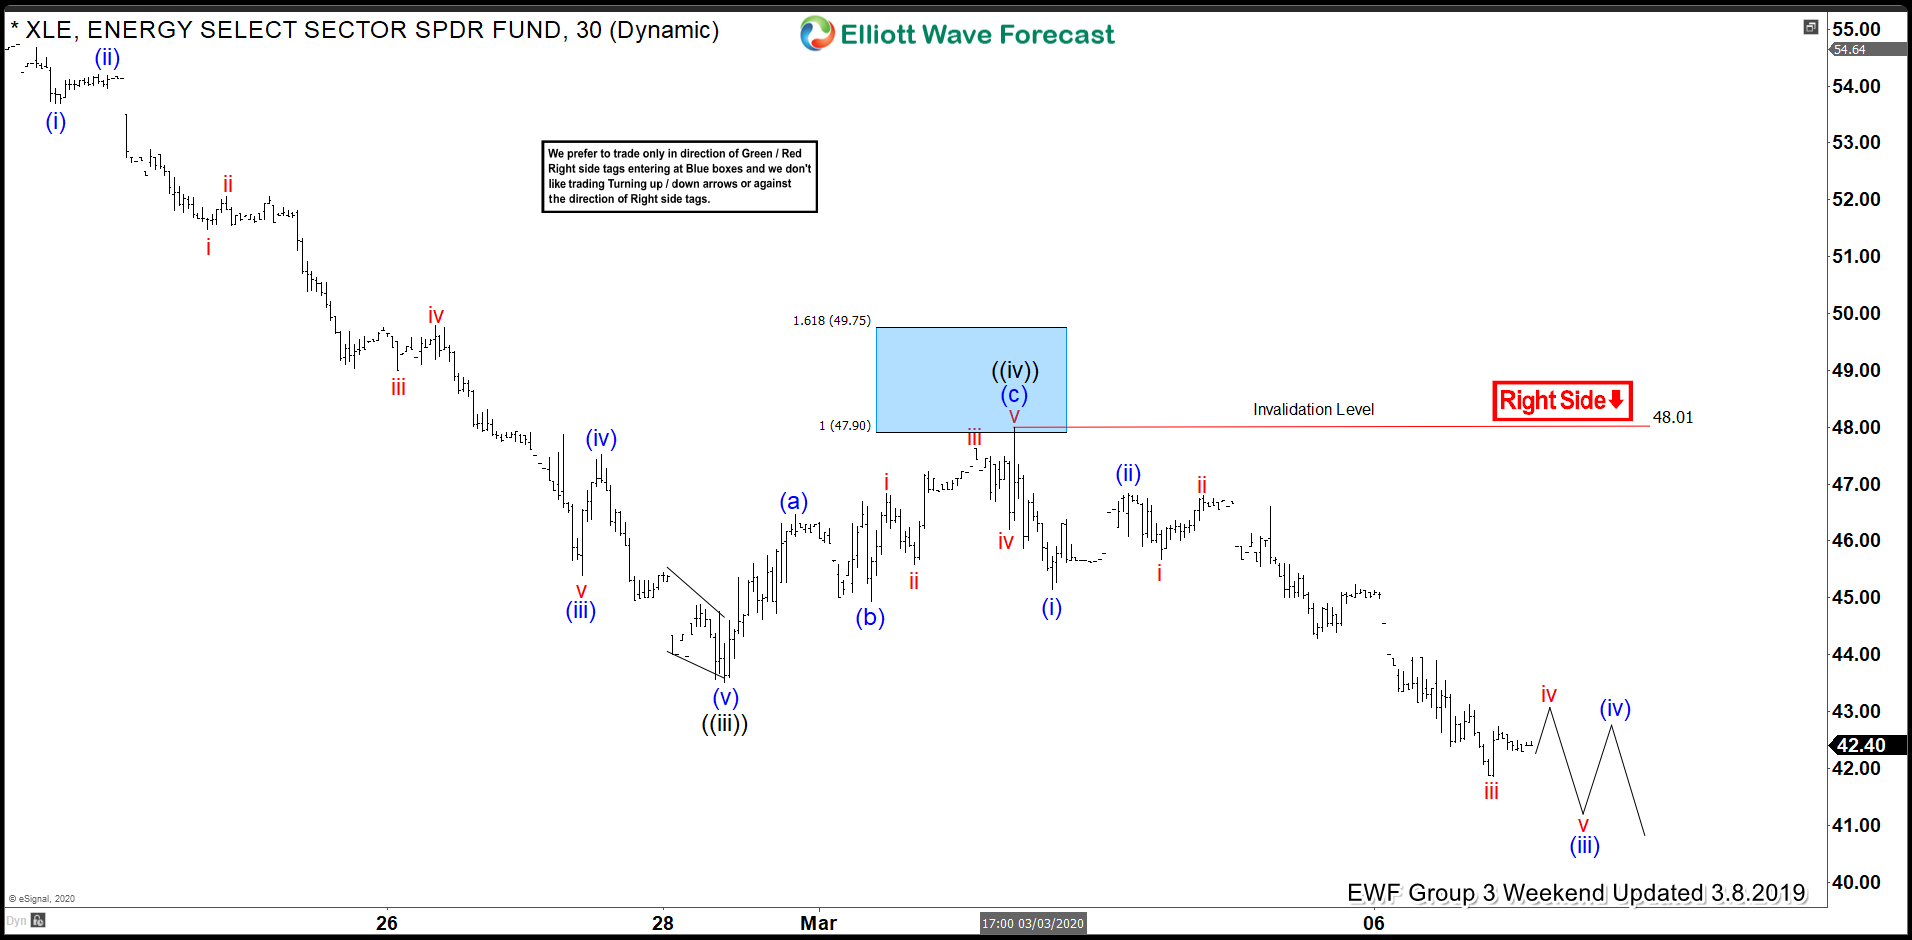
Here’s 1 Hour Elliott Wave Chart from 3/08/2020 Weekend update. In which the wave (c) managed to reach the blue box area at $47.90-$49.75. From there, the ETF found sellers as expected and made new lows as expected.