
AUDJPY Technical Analysis
Every trader should always view the market in the “bigger picture” first. Viewing the market starting from a higher time frame down to a lower time frame will offer a trader a clearer picture of the markets and will also allow a trader to ultimately decide which side to trade.
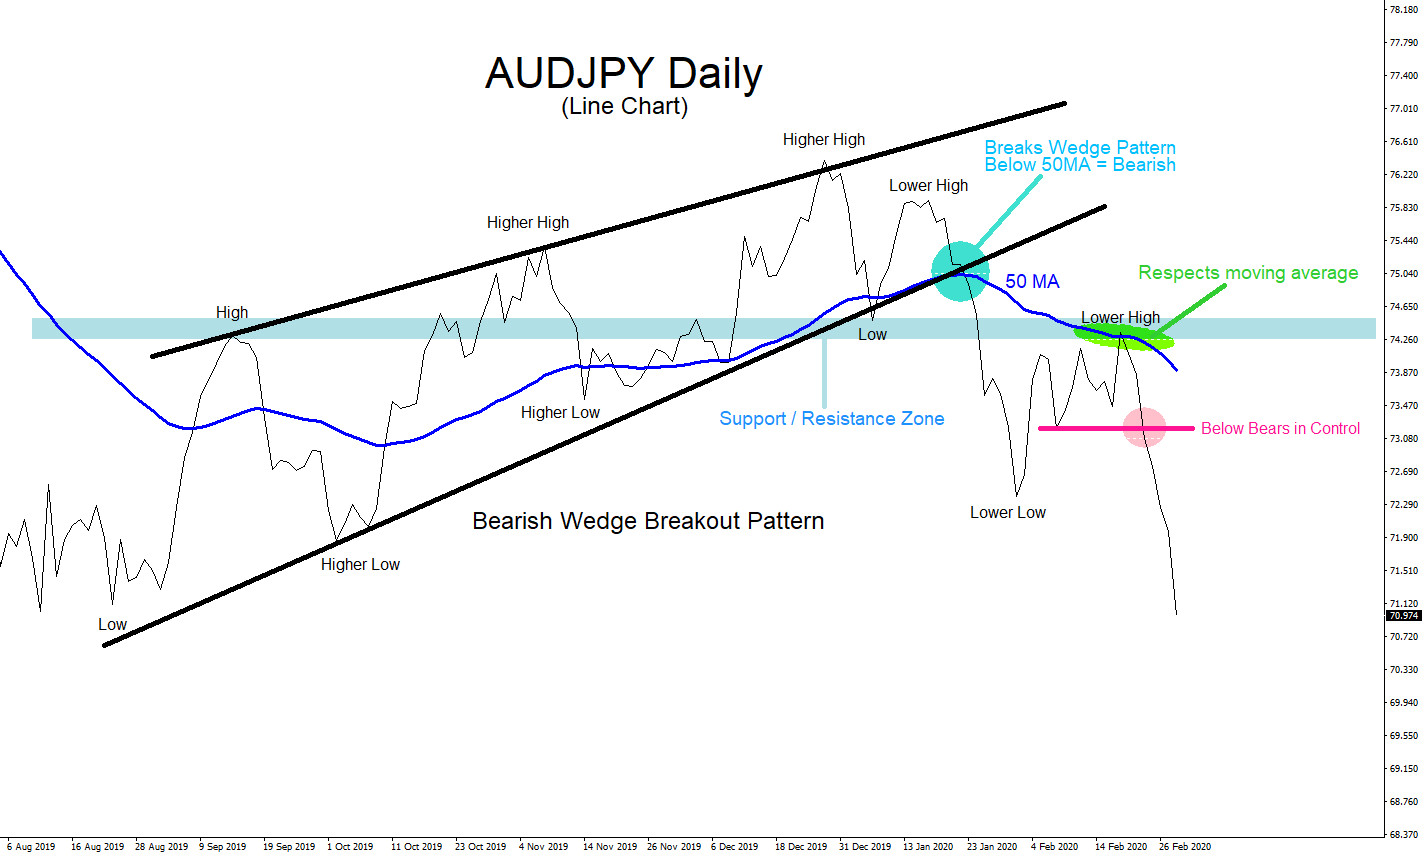
AUDJPY Daily Chart : September 2019 the pair started a sequence of higher highs and higher lows. During this move higher a clear visible bearish wedge breakout pattern formed and terminated at the end of December 2019. Start of 2020 the pair dipped lower then bounced and registered the first lower high which led to a break below the bottom trend line of the wedge pattern signalling that bears/sellers were taking control. A new lower low registered at the end of January 2020 signalling that a possible new trend lower was starting. Price was also trading below the 50 moving average which was another signal for traders to continue looking for SELL opportunities. In February 2020 price retests the 50 moving average and failed to move above it. At the same time, price also entered a support/resistance zone which added more bears to enter the market. After price respected the 50 moving average, I marked the key breakout level (pink) where bears will take back control and push the pair lower. By seeing all this develop on the Daily Chart, before the start of the February 23-28 2020 trading week, a trader would know that the trade setup to watch for was selling AUDJPY.
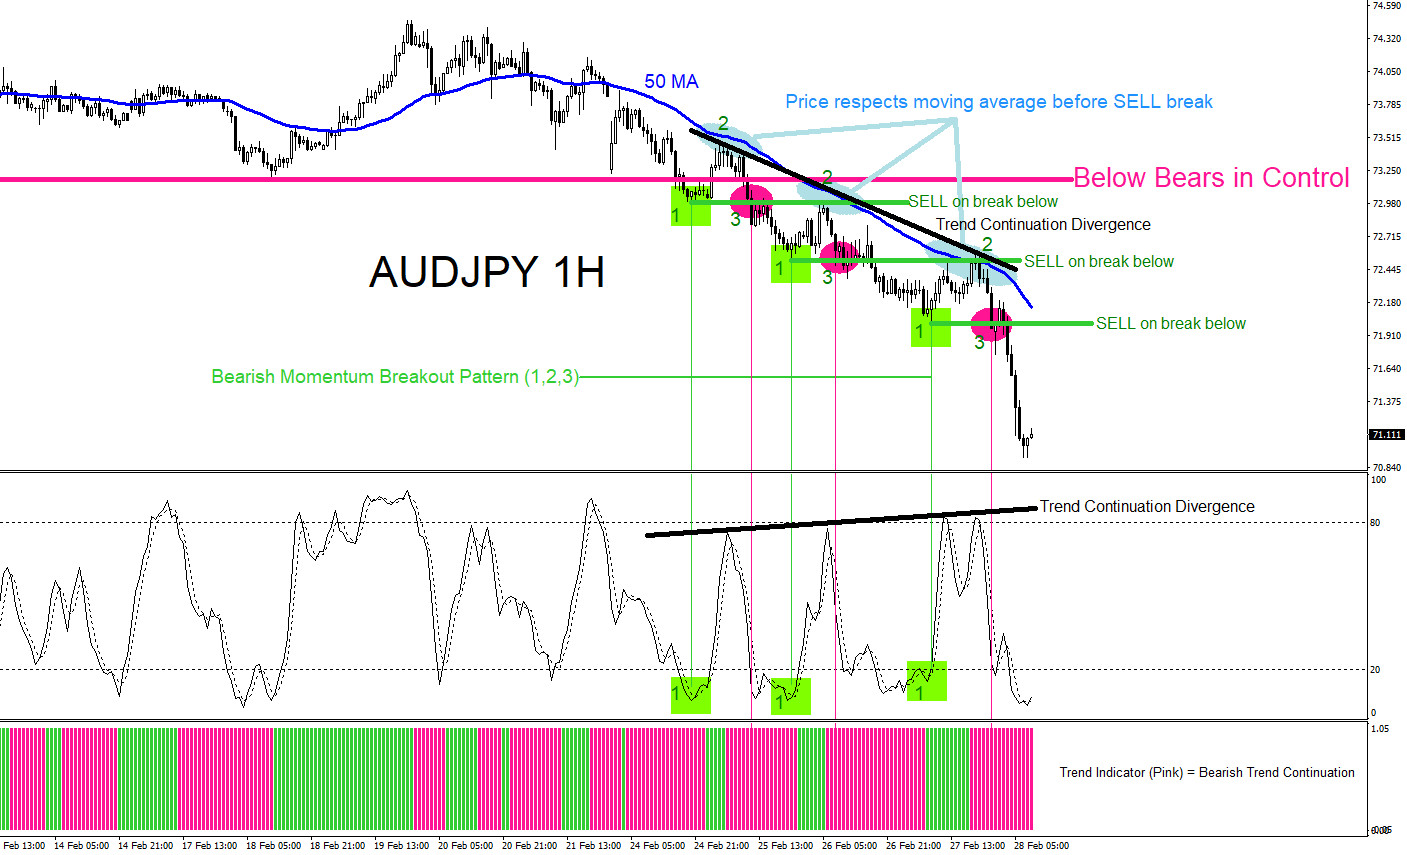
AUDJPY 1 Hour Chart : Once price broke below the key level (pink) the first bearish momentum breakout pattern formed. A bearish momentum breakout pattern requires 3 steps to trigger a SELL. First, a low on price chart forms simultaneously with a low below the 20 level on the Stochastic indicator. Second, a pullback in price that respects the 50 moving average together with a move higher above the 20 level on the Stochastic indicator. And third, SELL on the move below the first step low breakout level only if price respected the 50 moving average and watch for Stochastic indicator to register back below the 20 level to confirm momentum. In the 1 Hour chart below, there were clear multiple breakout selling opportunities where a trader could have sold. AUDJPY moved over 350 pips lower (approximately) during the February 23-28 trading week.
Of course, like any strategy/technique, there will be times when the strategy/technique fails so proper money/risk management should always be used on every trade. Hope you enjoyed this article and follow me on Twitter for updates and questions> @AidanFX or chat me on Skype > EWF Aidan Chan