
AUDUSD Technical Analysis
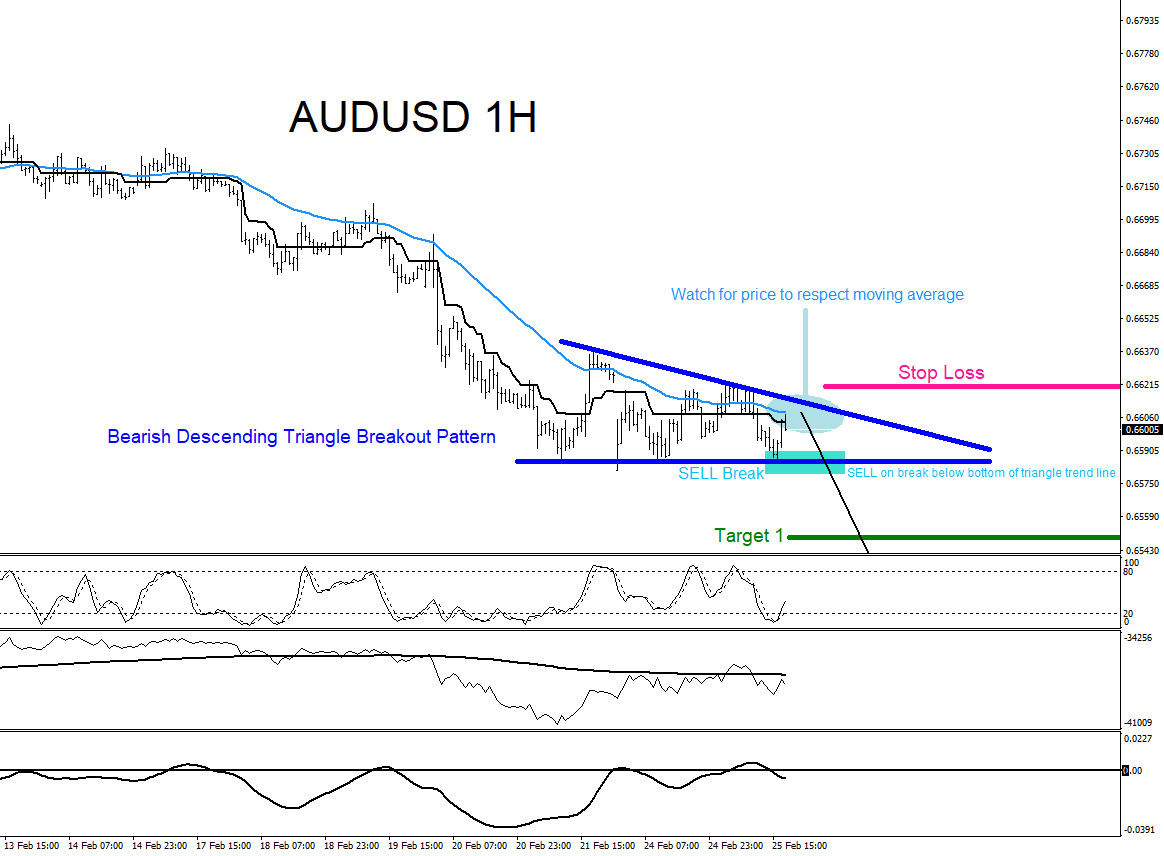
On February 25/2020 I posted on social media (Stocktwits/Twitter) @AidanFX “$AUDUSD watch for selling opportunities for extension lower .”
AUDUSD 1 Hour Chart 2.25.2020 : The chart below was also posted on social media (StockTwits/Twitter) @AidanFX February 25/2020 showing that a bearish descending triangle breakout pattern (blue) was forming. I called for traders to watch for SELLS on the break below the triangle as long as price respects the moving average (light blue).
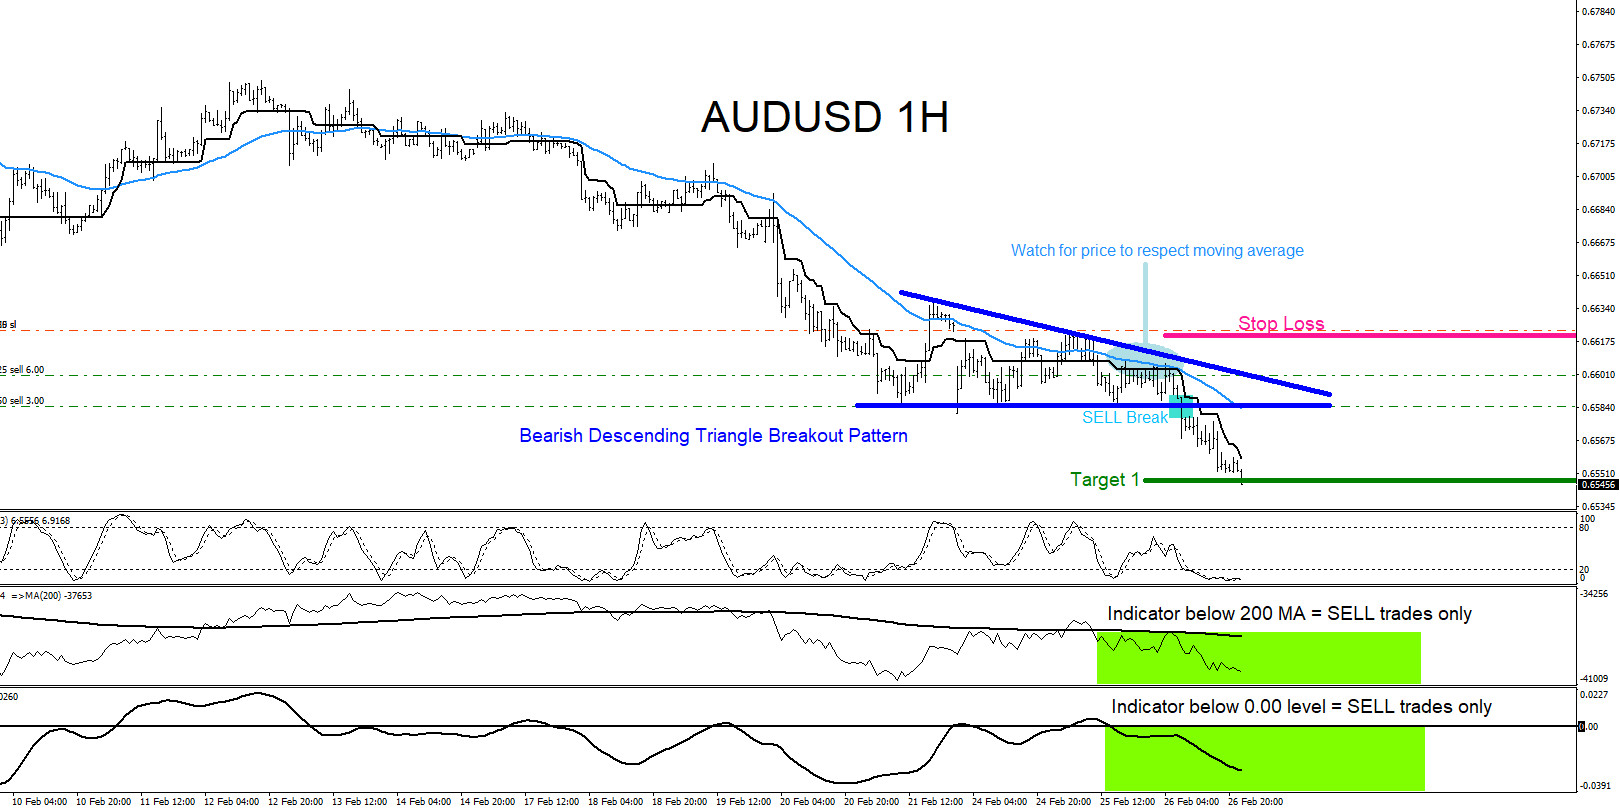
AUDUSD 1 Hour Chart 2.26.2020 : Price respects the moving average and breaks below the triangle pattern triggering the bearish pattern SELLS. Momentum and trend indicators also confirmed the SELLS. After the break, price instantly moves lower and hits the first target $$$.
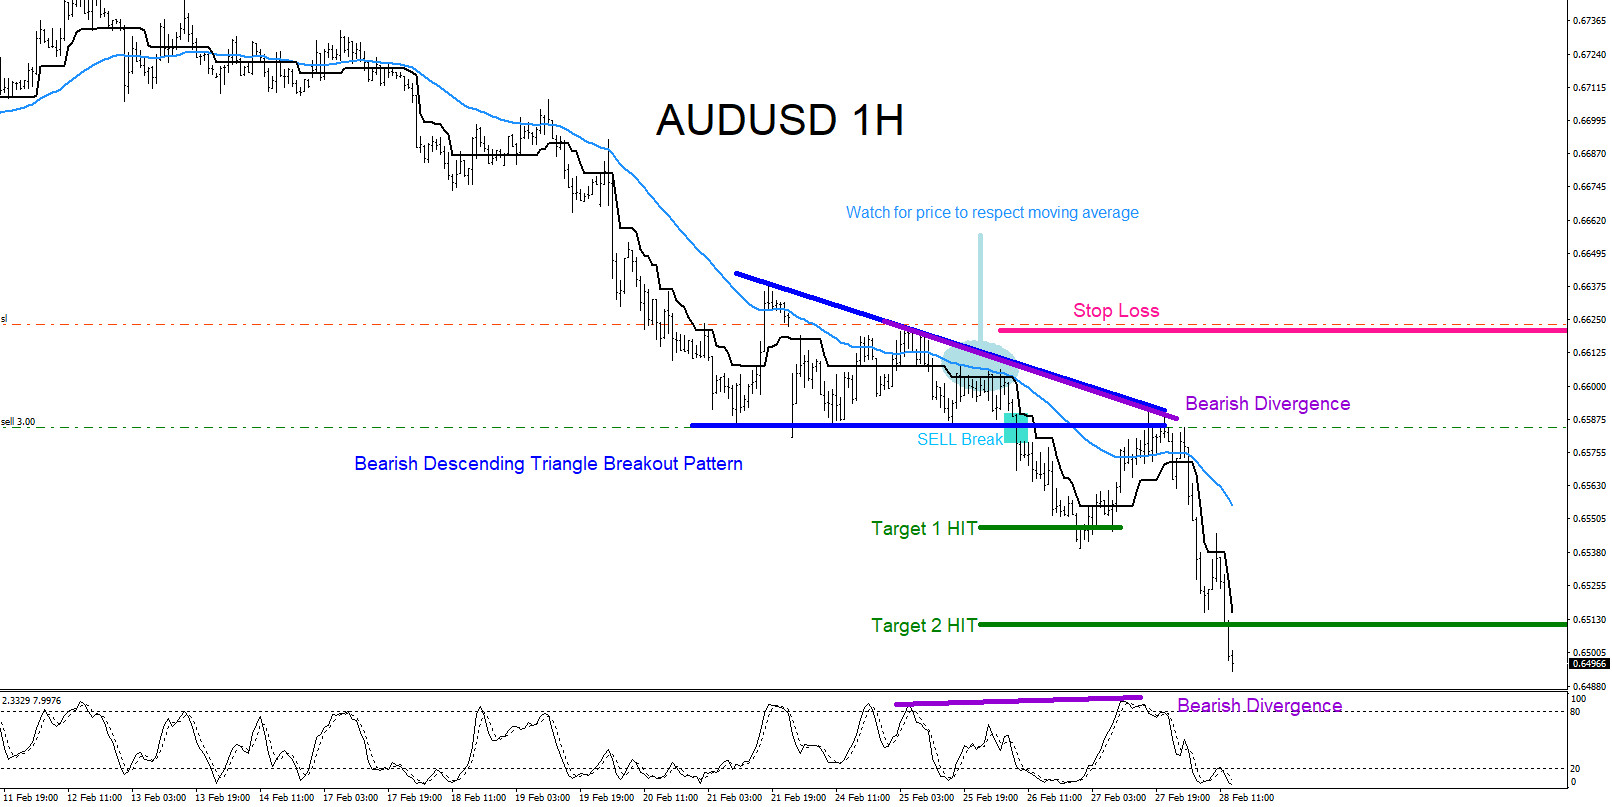
AUDUSD 1 Hour Chart 2.28.2020 : After the first SELL target hit, price bounces higher back to the SELL entry level where it was met with the previous support zone which now became a new resistance zone. Also in this area, a bearish divergence (purple) formed which allowed a trader to feel positive on continuing to hold the SELL trade. Price reverses and continues the move lower eventually hitting the 2nd target $$$. If you followed me on Twitter/Stocktwits you too could have caught the AUDUSD move lower.
Of course, like any strategy/technique, there will be times when the strategy/technique fails so proper money/risk management should always be used on every trade. Hope you enjoyed this article and follow me on Twitter for updates and questions> @AidanFX or chat me on Skype > EWF Aidan Chan