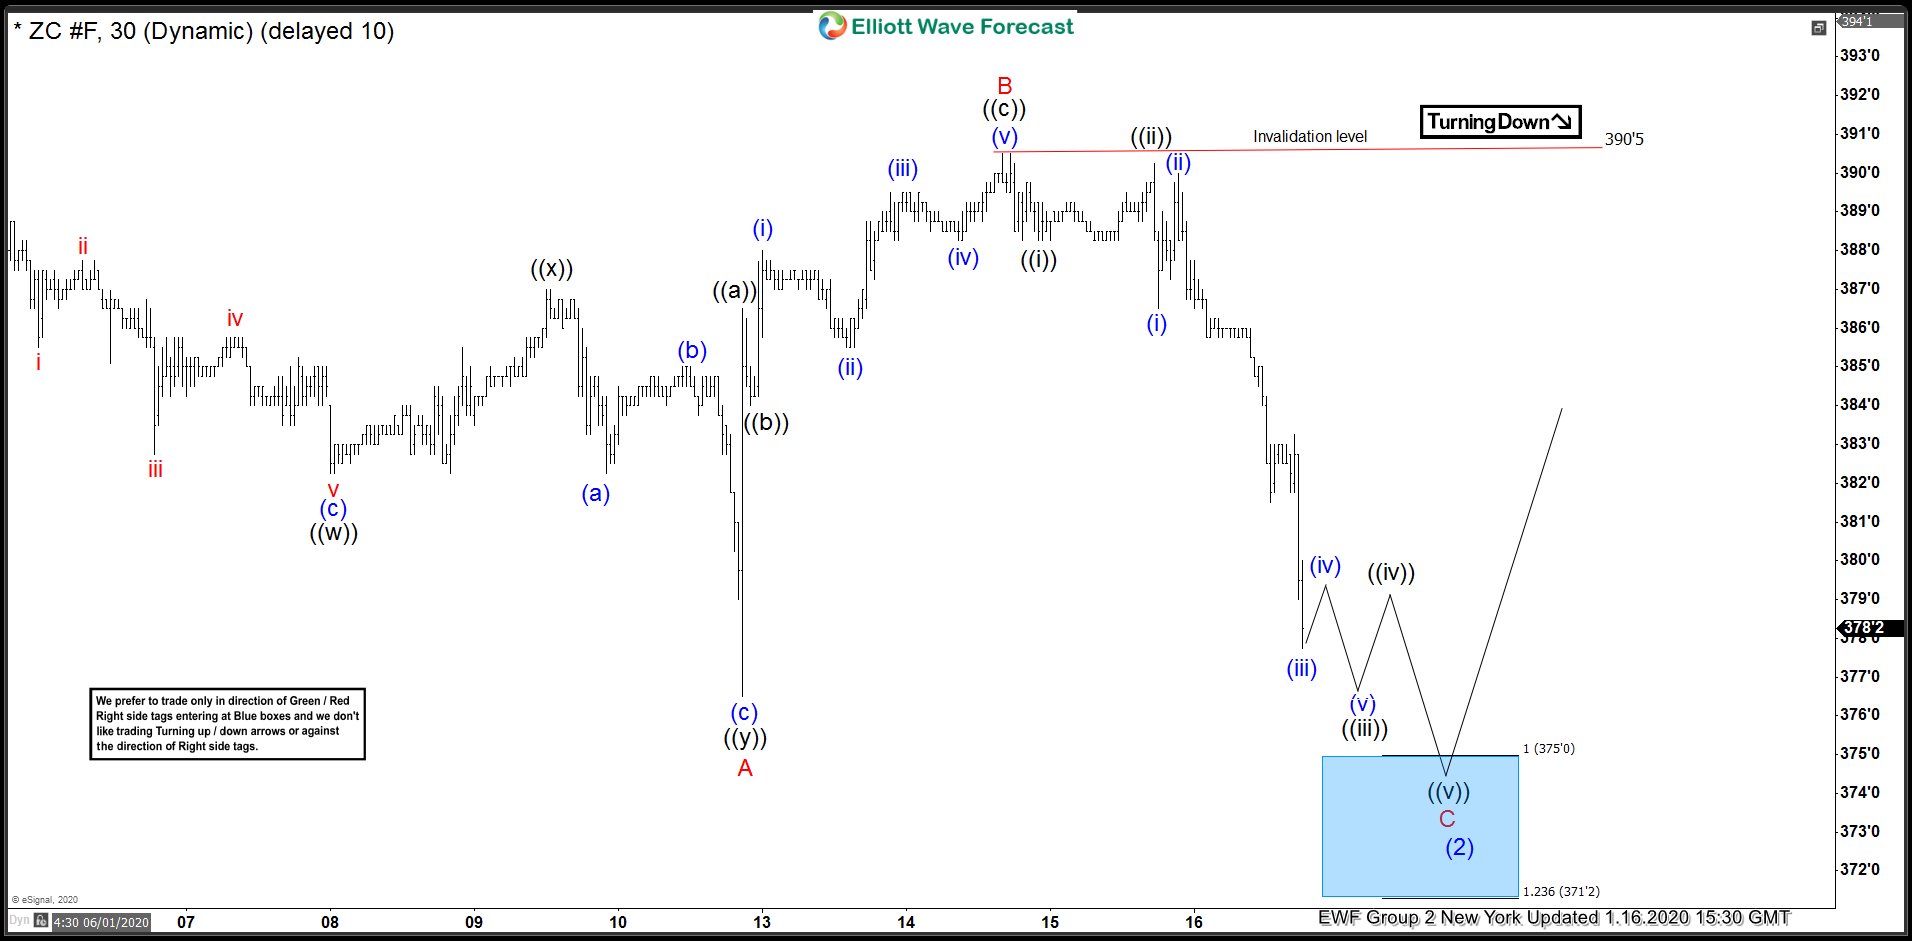
In this blog, we are going to take a quick look at the Elliottwave chart of Corn (ZC_F). The chart from 1.16.2020 New York update showed that Corn was doing a pullback in wave (2). Wave A of (2) ended at 376’4 low. Wave B of (2) ended at 390’5 high. From there, we expect the pair to extend lower in 5 waves to complete wave C of (2). The 100%-161.8% Fibonacci extension of A – B where wave C can end is between 371’2 – 375 area, highlighted with a blue box. The blue box area is the area where we expect buyers to appear for an extension higher or 3 waves bounce at least.
ZC_F 1.16.2020 1 Hour New York Elliott Wave Update
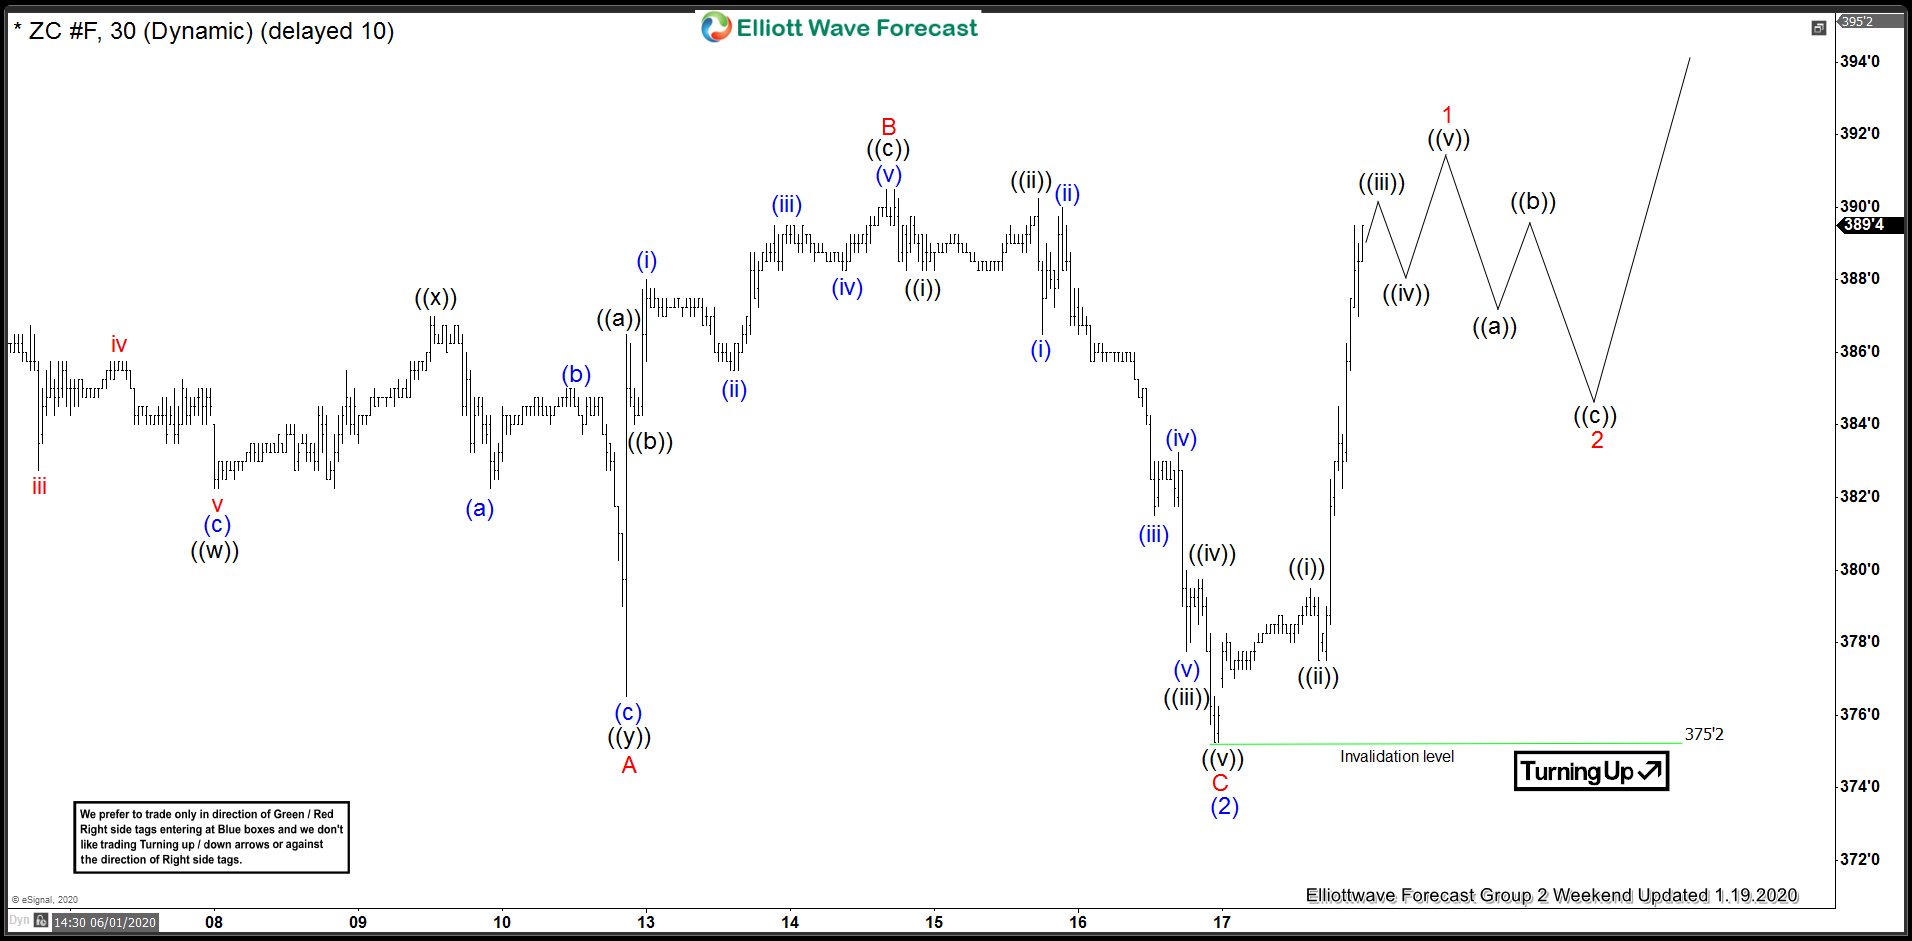
The chart below from 1.19.2020 weekend update shows that wave (2) ended at 375’2, which is the 100% extension area. Afterwards, the price bounced higher, in which it looks like an impulsive move up. This allowed members who bought from the blue box area a risk free trade.
ZC_F 1.19.2020 1 Hour Weekend Elliott Wave Update
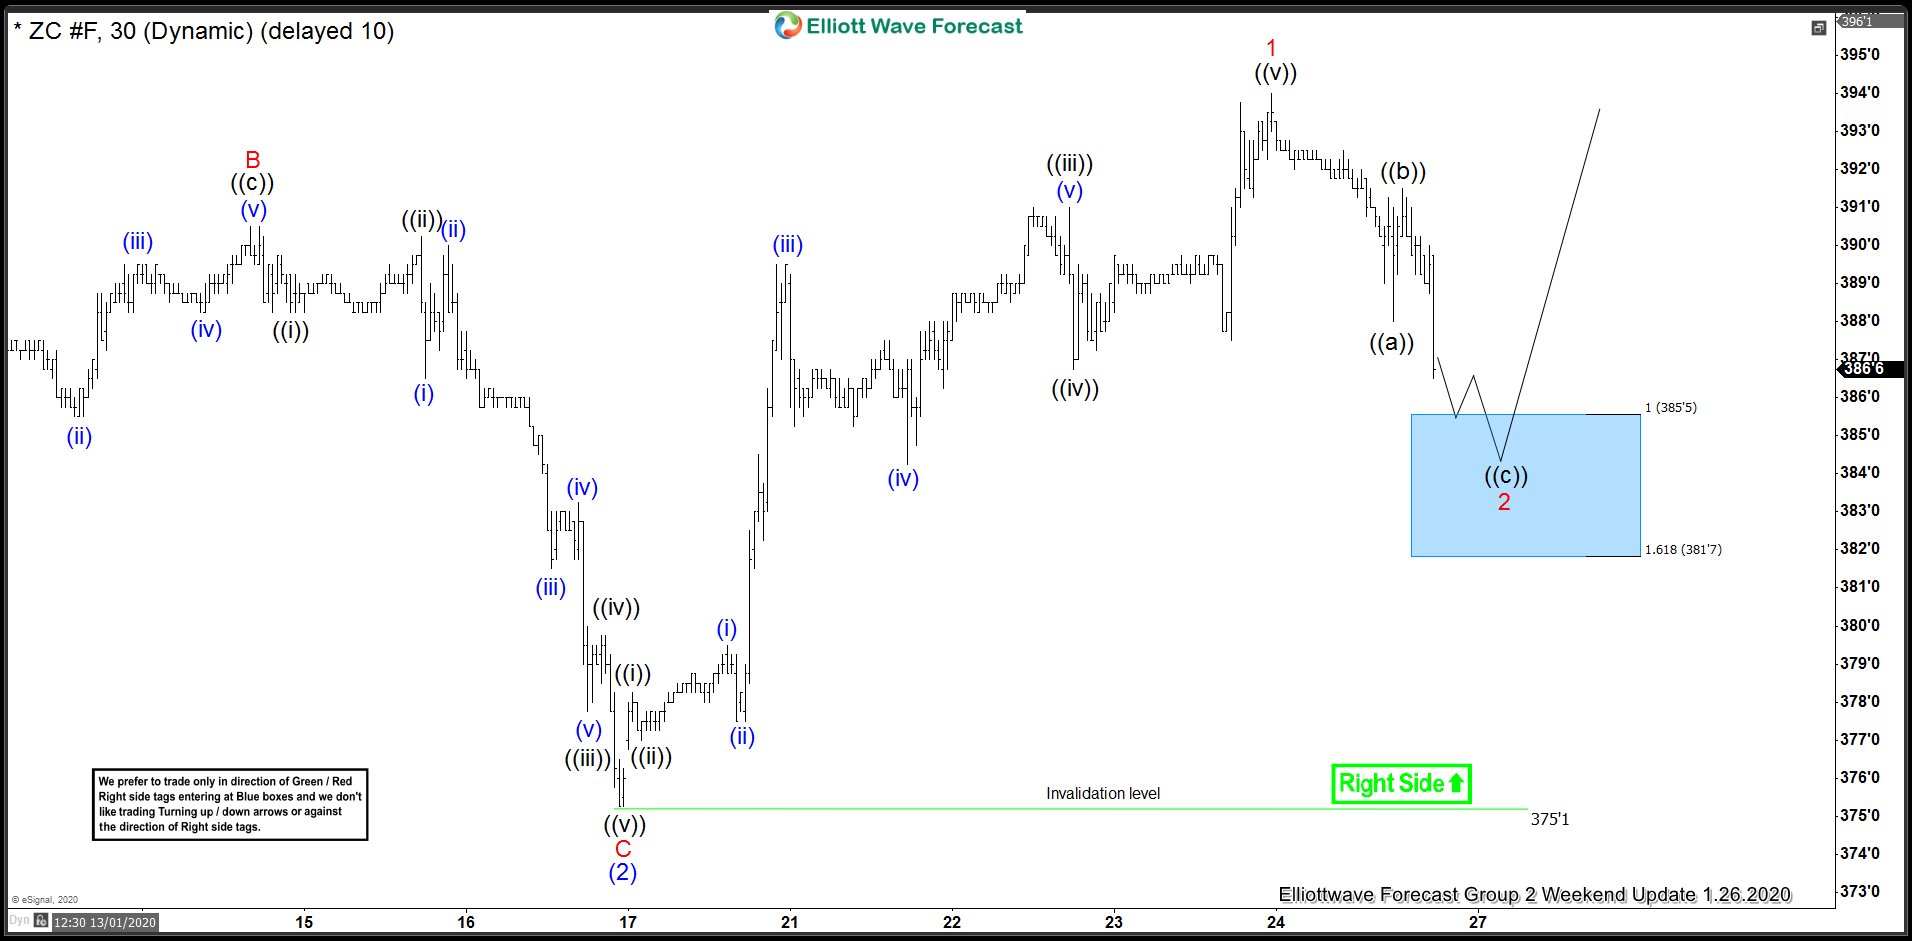
The moves up in wave 1 as shown in the chart below from 1.26.2020 update appears to end at 394 high. Corn is now expected to do a pullback in wave 2. Wave ((a)) of 2 ended at 388 low and wave ((b)) ended at 391’4 high. The 100%-161.8% Fibonacci extension of wave ((a))-((b)) is between 381’7 – 385’5 area. We expect to see a 3 waves bounce at least or even an extension higher from there. Thus, this area should provides an opportunity to buy the dip again. As long as the low of wave (2) at 375’2 stays intact, corn can still extend higher after the pullback in wave 2.
ZC_F 1.26.2020 1 Hour Weekend Elliott Wave Update