Russell Futures (RTY_F) decline ended cycle from 12/3 and started pulling back. It dropped in 3 waves to 1659.40 and bounced. The bounced appeared corrective so we called for a double three Elliott wave correction lower which was valid as far as price stayed below 12.27.2019 (1687.80). Below, we will present a series of charts to show the correction unfolded and how blue boxes proved to be critical bouncing areas.
Russell Futures (RTY_F) 1.2.2020 1 Hour London Chart
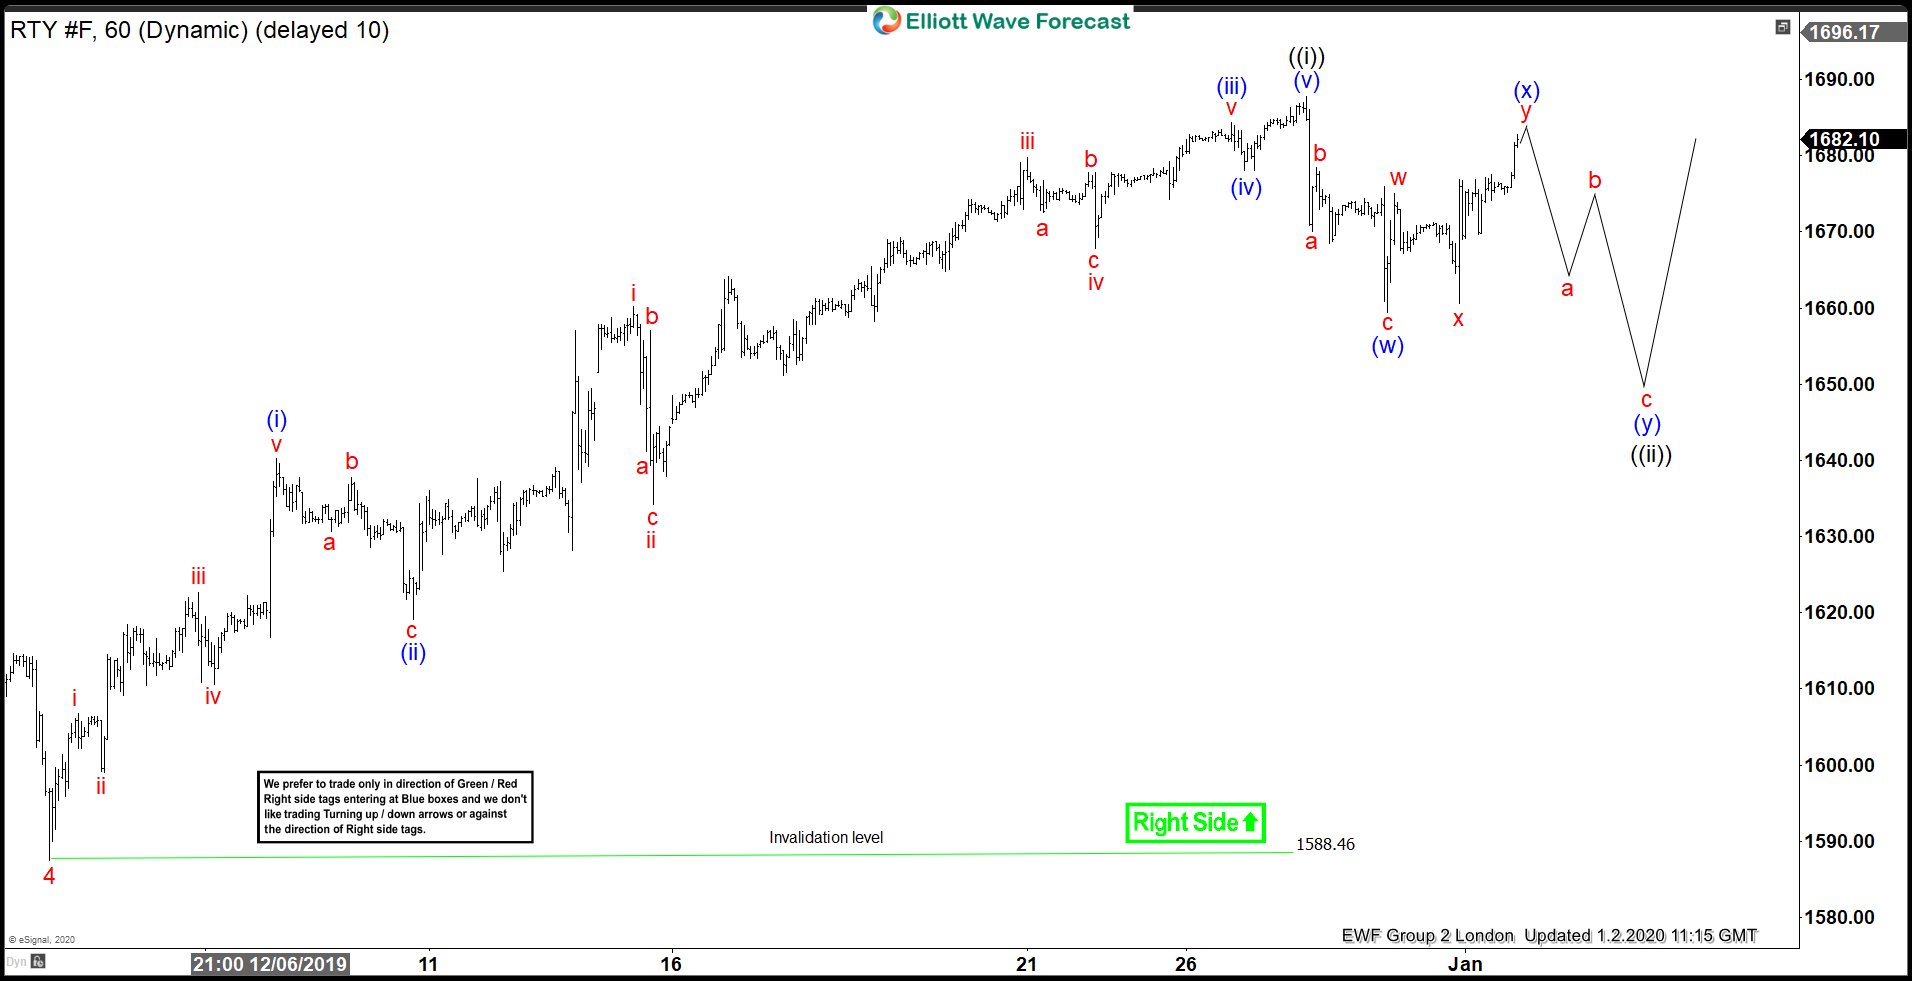
Price did manage to hold below 12.27.2019 (1687.80) peak and Index futures turned lower after forming a secondary peak at 1684.80. Decline from secondary peak appeared impulsive so we have relabelled the secondary peak as wave (b) and expecting structure of the decline from 12.27.2019 peak to be a 3-3-5 FLAT rather than a double three structure. Let’s take a look at the chart from New York update on the same day.
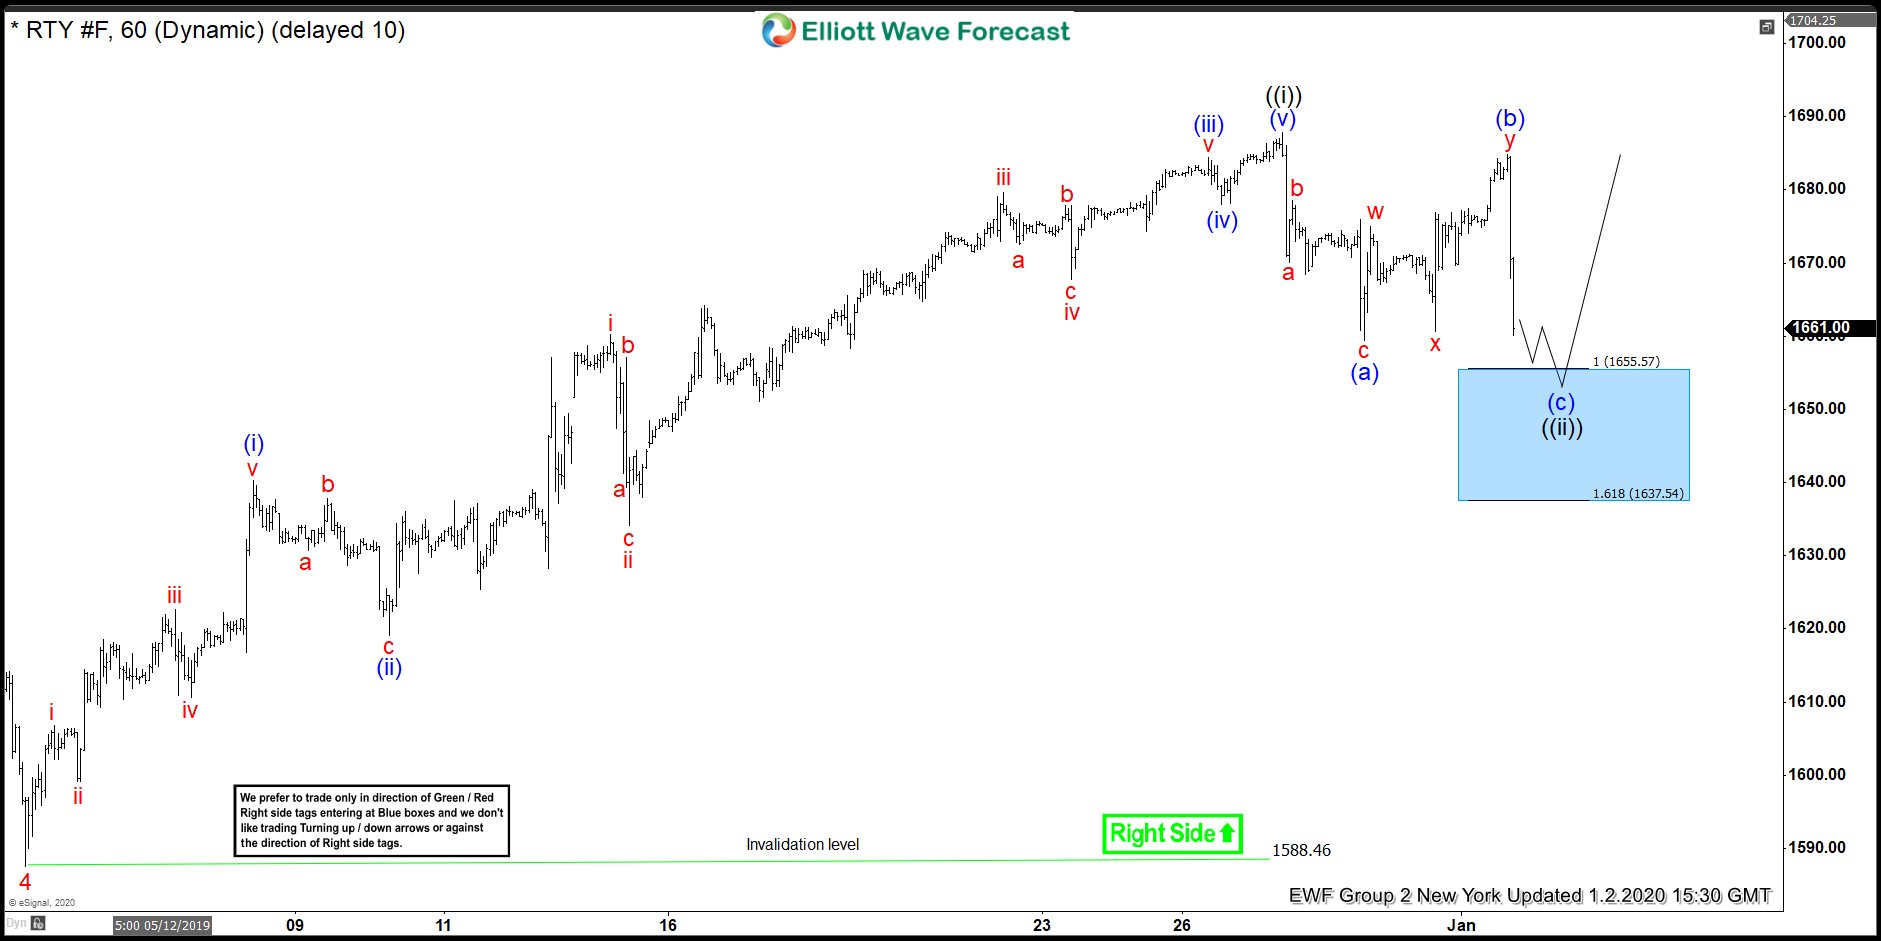
Russell Futures (RTY_F) 1.2.2020 1 Hour New York Chart
Chart below highlighted 1655.57 – 1637.54 to be an area where we expected 3-3-5 Elliott wave FLAT structure to end and then Russell futures to resume the rally for a new high in wave ((iii)) or bounce in 3 waves at least. Blue boxes are no enemy areas where both buyers and sellers agree in the direction of the next move for 3 swings at least.
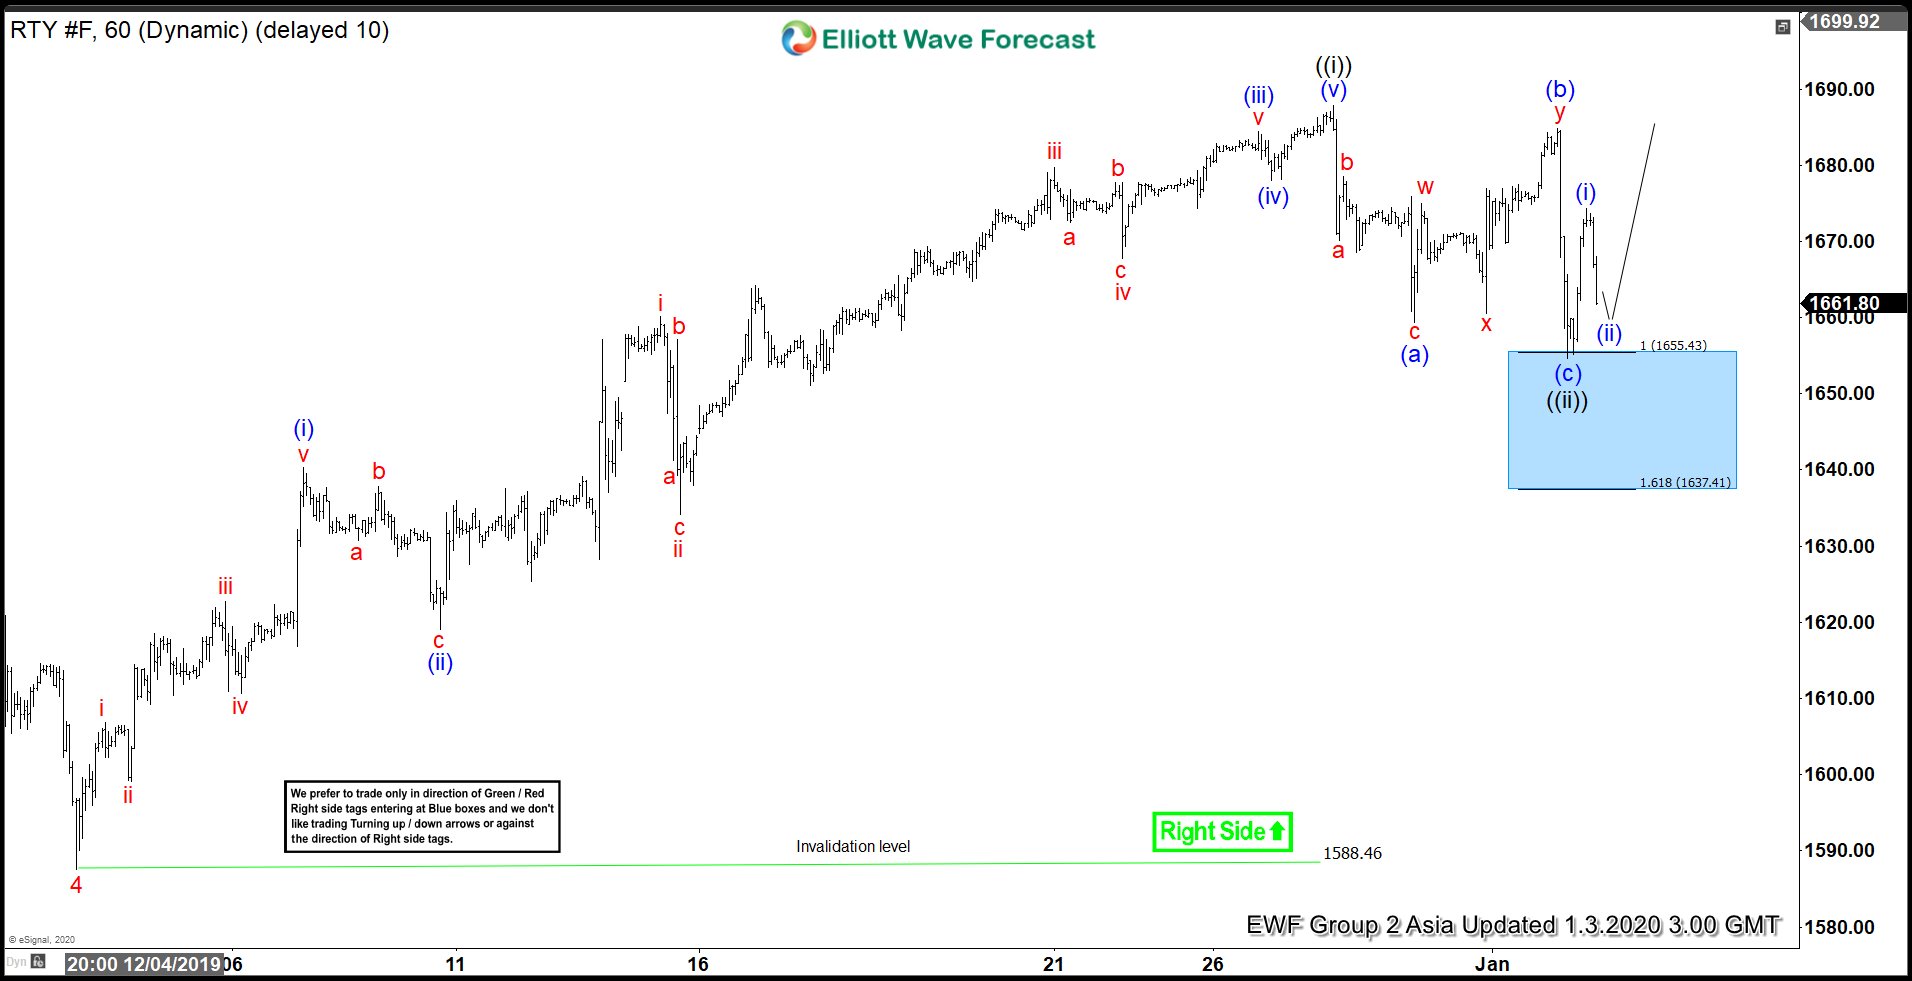
RTY_F 1.3.2020 1 Hour Asia Chart
Russell Futures reached the blue box and bounced to reach 50% Fibonacci retracement of the decline from (b) wave at 1669.84 allowing any buyers from blue box to get into a risk free position. However, it failed to continue higher and once again broke below 1.2.2020 (1654.60) low opening another extension lower as a larger double three correction.
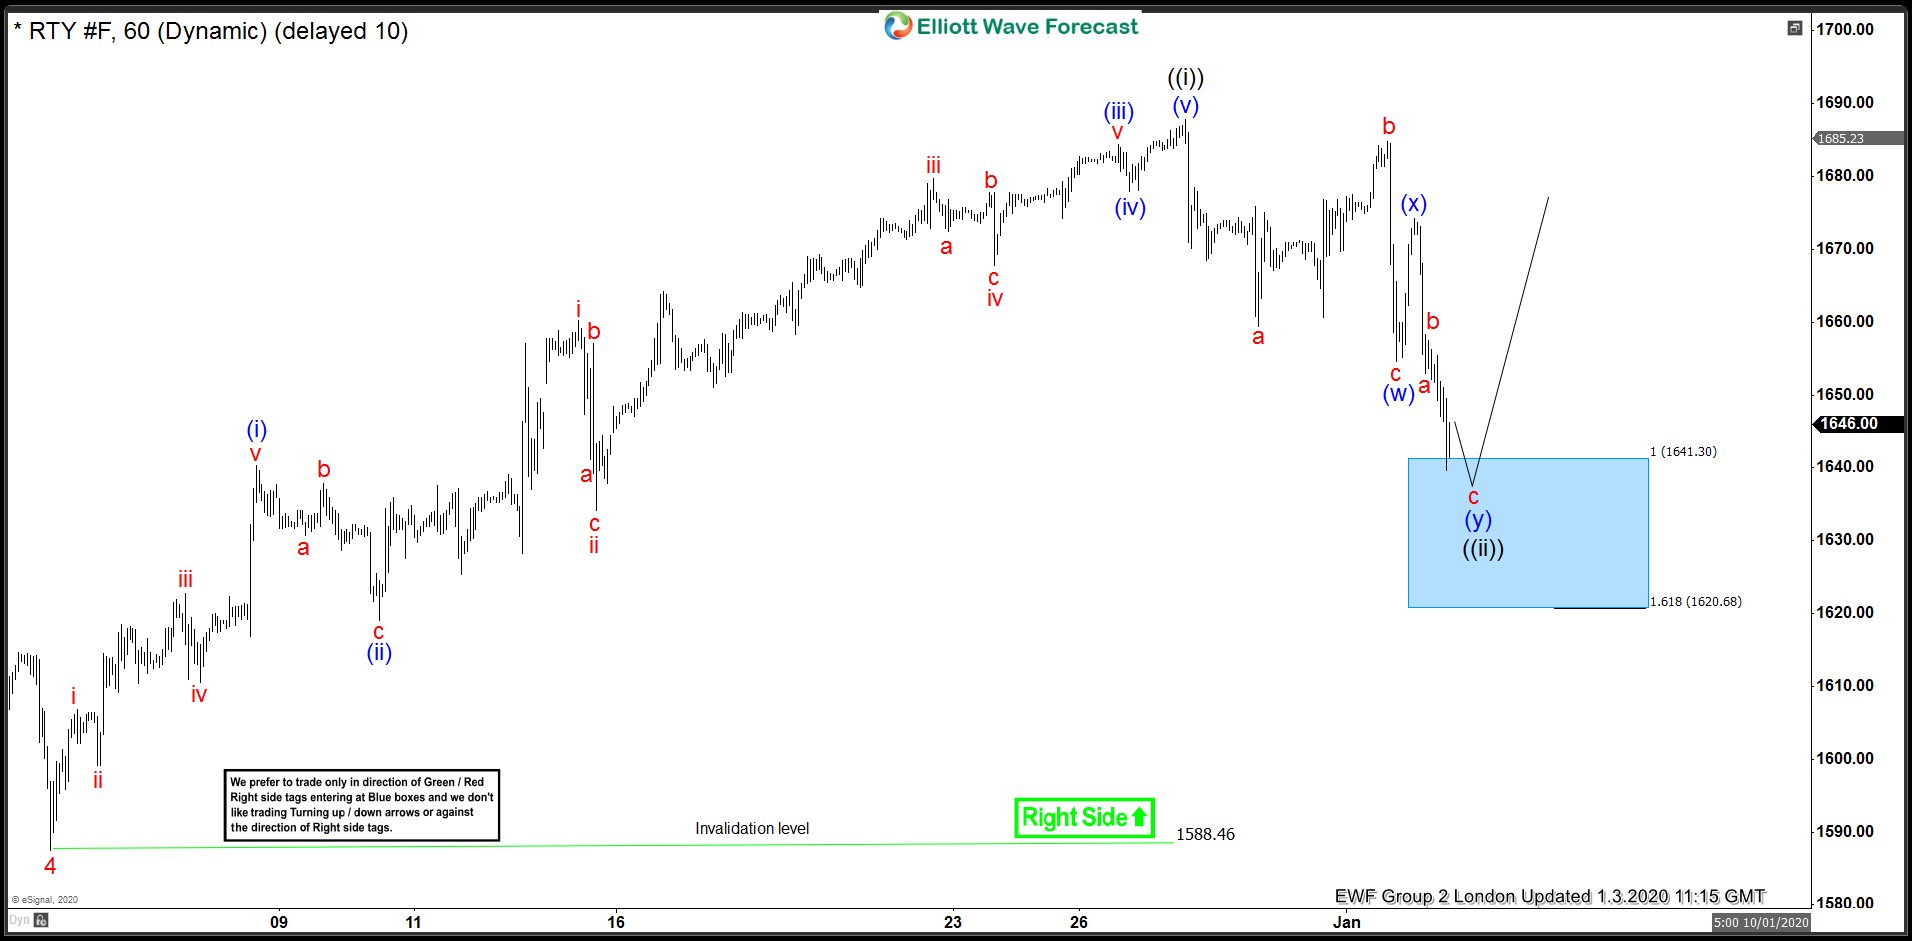
Russell Futures (RTY_F) 1.3.2020 1 Hour London Chart
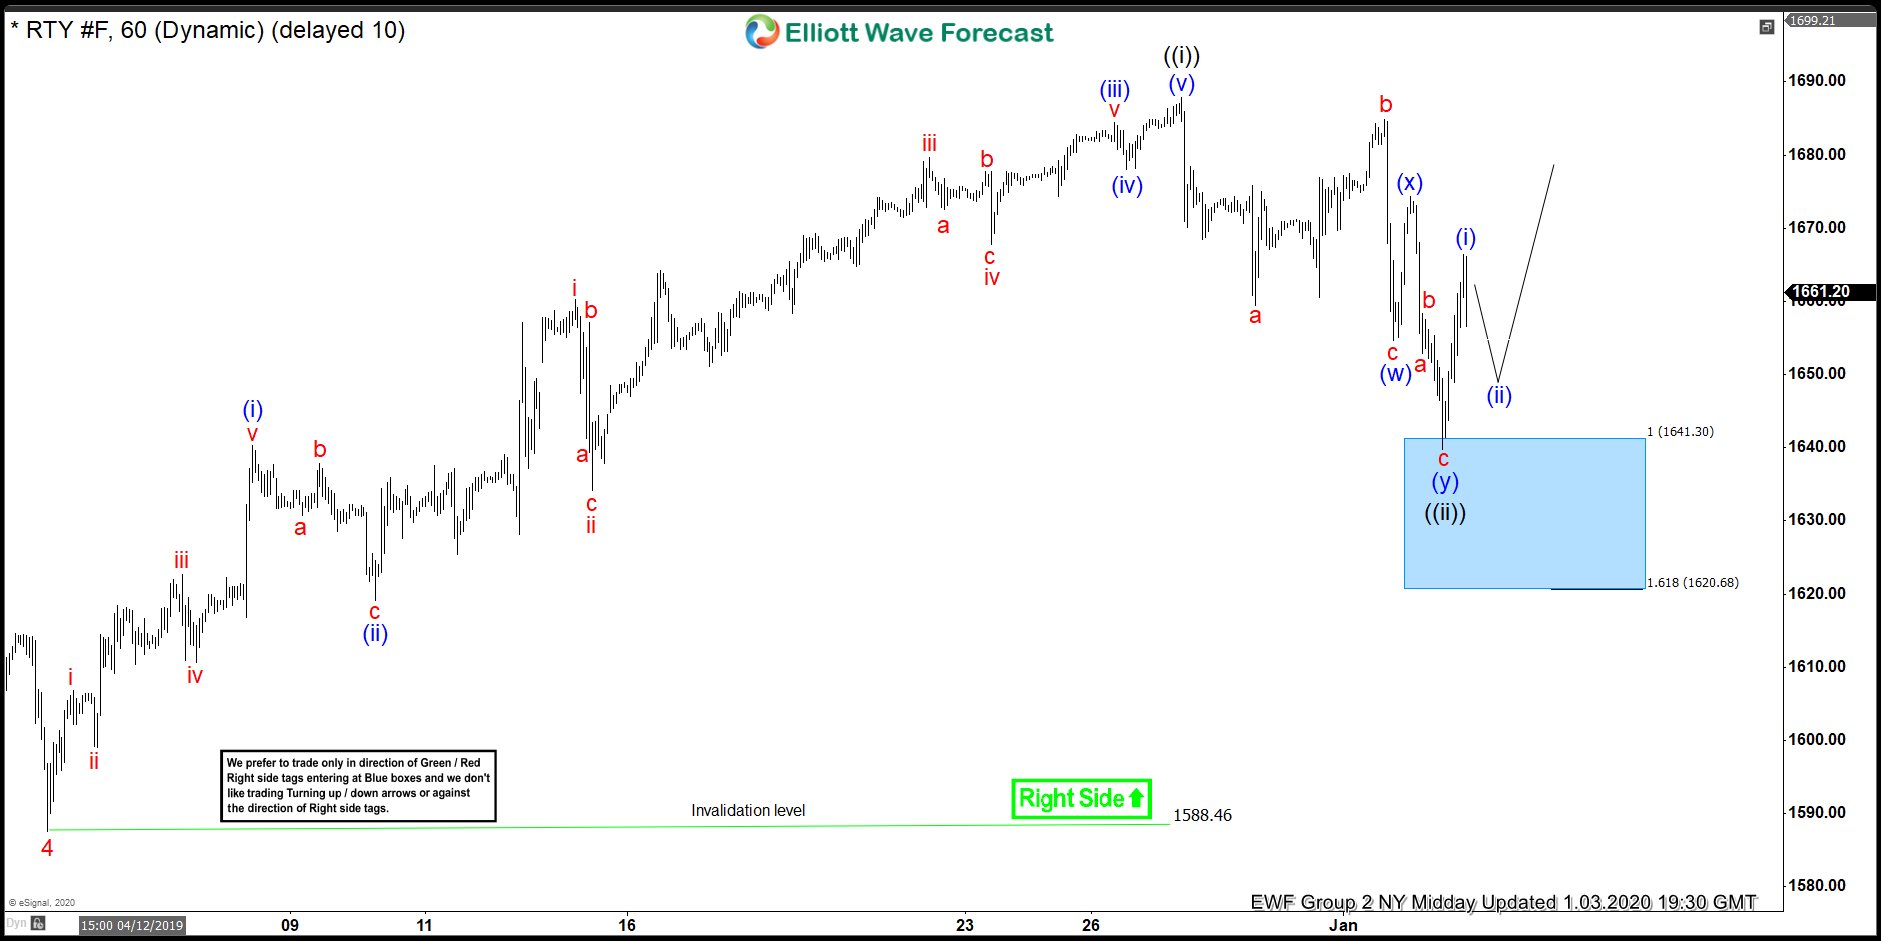
Chart below showed 1641.30 – 1620.68 as next blue box area to end a double three Elliott wave structure and highlighted the area from where we expected Russell futures to turn higher and resume the rally in wave ((iii)) or bounce in 3 waves at least. We can see price has entered the blue box and needed to stay above the bottom of the blue box i.e. 1.618 (1620.68) level for the decline to remain corrective or else the decline could have extended.
RTY_F 1.3.2020 1 Hour Midday chart
Chart below shows Russell Futures reached the blue box and bounced as expected. Bounce quickly reached 50% Fibonacci retracement (1657.02) of the decline from blue (x) peak allowing any buyers from blue box to get into a risk free position. Now as far as dips hold above 1639.70 low, expect Index futures to continue higher. Break below would open another extension lower as a 15 swings corrective structure before Index futures would once again have a chance to resume the rally or produce a 3 waves bounce at least.