Financial markets have evolved dramatically over time, moving from human-dominated trading floors to highly automated, algorithm-driven systems. Two concepts that represent these different eras are the Elliott Wave Theory and high-frequency trading (HFT), Elliott Wave Theory focuses on market psychology and recurring price patterns. HFT on the other hand relies on advanced algorithms and ultra-fast execution.
Elliott Wave Theory
The Elliott Wave Theory, developed by Ralph Nelson Elliott in the 1930s, suggests that financial markets move in predictable patterns driven by collective investor psychology. According to the theory, prices move in a series of five impulsive waves in the direction of the main trend. It was then followed by three corrective waves against the trend. These wave patterns are fractal, meaning they appear on all timeframes, from long-term market cycles to short-term price movements. As a reference, please check this page: https://elliottwave-forecast.com/elliott-wave-theory/. This page provides an overview of the main Theory. It also contains new rules we have added to improve it and avoid a subjective tone.
Elliott Wave Theory is widely used by technical analysts to identify market trends, predict potential reversals, and understand the psychological forces behind price movements. The main sequences are 5-9-13-17-21 when the market moves in an impulse structure. These sequences always go with the main trend. Corrective sequence runs in 3-7-11-15-19. Corrective structure can run in a Zig-Zag (5-3-5) which is 3 waves. Another one is a double Zig Zag which is (5-3-5-3-5-3-5) and runs in 7 swing. A Triple Zig- Zag which is (5-3-5-3-5-3-5-3-5-3-5) runs in 11 swing. Sometimes we can also see Flats which runs as 3-3-5 or Triangles. The corrective structure are key to enter the market and we will explain later why.
High-Frequency Trading
High-frequency trading refers to the use of sophisticated computer algorithms to execute a large number of trades at extremely high speeds, often within microseconds. HFT firms aim to profit from small price discrepancies, market inefficiencies, and short-term liquidity imbalances. Unlike traditional trading methods, high-frequency trading does not rely on human judgment or long-term market predictions. Instead, it focuses on speed, data, and statistical models.
There is little doubt that technological advancement has become a dominant force in modern society. Financial markets have not remained unaffected by its influence. The growing presence of computers in trading has highlighted how algorithmic systems consistently execute trades at recurring entry and exit levels with notable accuracy. As discussed previously, significant effort has been devoted to identifying these key price areas and linking them to Elliott Wave Theory.
The Market Code
At Elliott Wave Forecast, we have identified the Market Code through years of market observation and analysis. This concept became widely recognized through the recurring corrective structure known as 3–7–11 with the trend. The idea is simple: the market follows a code, one that Ralph Nelson Elliott came very close to identifying nearly one hundred years ago.
According to this code, market corrections unfold in 3, 7, or 11 swings. Impulsive movements on the other hand develop in 5, 9, or 13 waves. Each individual wave has a defined price area from which it begins and ends. Understanding this structure greatly enhances the application of Elliott Wave Theory, particularly when combined with high-frequency and algorithmic trading systems.
Although market behavior can be influenced by news events, economic data, and human psychology, the key lies in recognizing these repeating sequences. Both impulsive and corrective patterns are closely related to Fibonacci retracements and extensions, which help define precise price targets and invalidation levels.
It is important to recognize that computers must be programmed by humans, and many of those programmers may not be familiar with Elliott Wave Theory itself. Instead, algorithms respond to the underlying market code embedded in price behavior. As a result, the theory adapts to the presence of machines, rather than machines consciously applying the theory.
Like any programmed system, algorithmic trading requires triggers and confirmations. In practical terms, when price reaches an area identified by the market code, buy or sell decisions are executed as long as the confirmation pivot remains intact. Unlike human traders, computers act without emotion, executing trades with precision and consistency.
In modern markets, this machine-driven structure increasingly governs price behavior. The Market Code, as expressed through algorithmic execution, has become a dominant force shaping market movements.
Our System
Using this systematic approach, we delivered returns exceeding 140 percent to our members in 2026. We rely exclusively on a methodology that combines Elliott Wave Theory with algorithm-driven market behavior. From Elliott Wave Theory, we extract the fundamental principle that markets advance in five-wave sequences during trends and correct in three-wave sequences against the trend.
Rather than treating Elliott Wave Theory as a rigid forecasting tool, we use it as a market language. It is a framework that helps identify incomplete price sequences and potential continuation points. While the theory itself is highly effective, its greatest practical value emerges during market pullbacks against the dominant trend. These corrective phases often represent moments when high-frequency trading systems re-enter the market in the direction of the primary trend.
At these critical stages, we present subscribers with predefined price areas known globally as “Blue Box” zones. These areas are derived from a combination of Elliott Wave structure and the behavior of high-frequency trading algorithms. To further refine these zones, we developed a pivot validation system, which incorporates momentum-based indicators to serve as confirmation triggers for trade entries.
Although no trading methodology can guarantee certainty, historical performance shows that approximately 85 percent of the time, price reacts upon reaching a Blue Box area. Exceptions typically occur during flat corrections, when corrective structures extend. Another one occurs when a trend transitions into a higher-degree correction, causing the structure to shift from a 3–7–11 corrective pattern to a 5–3–5 formation. Even with these exceptions, the consistency of reactions from the Blue Box zones highlights the robustness of the combined approach.
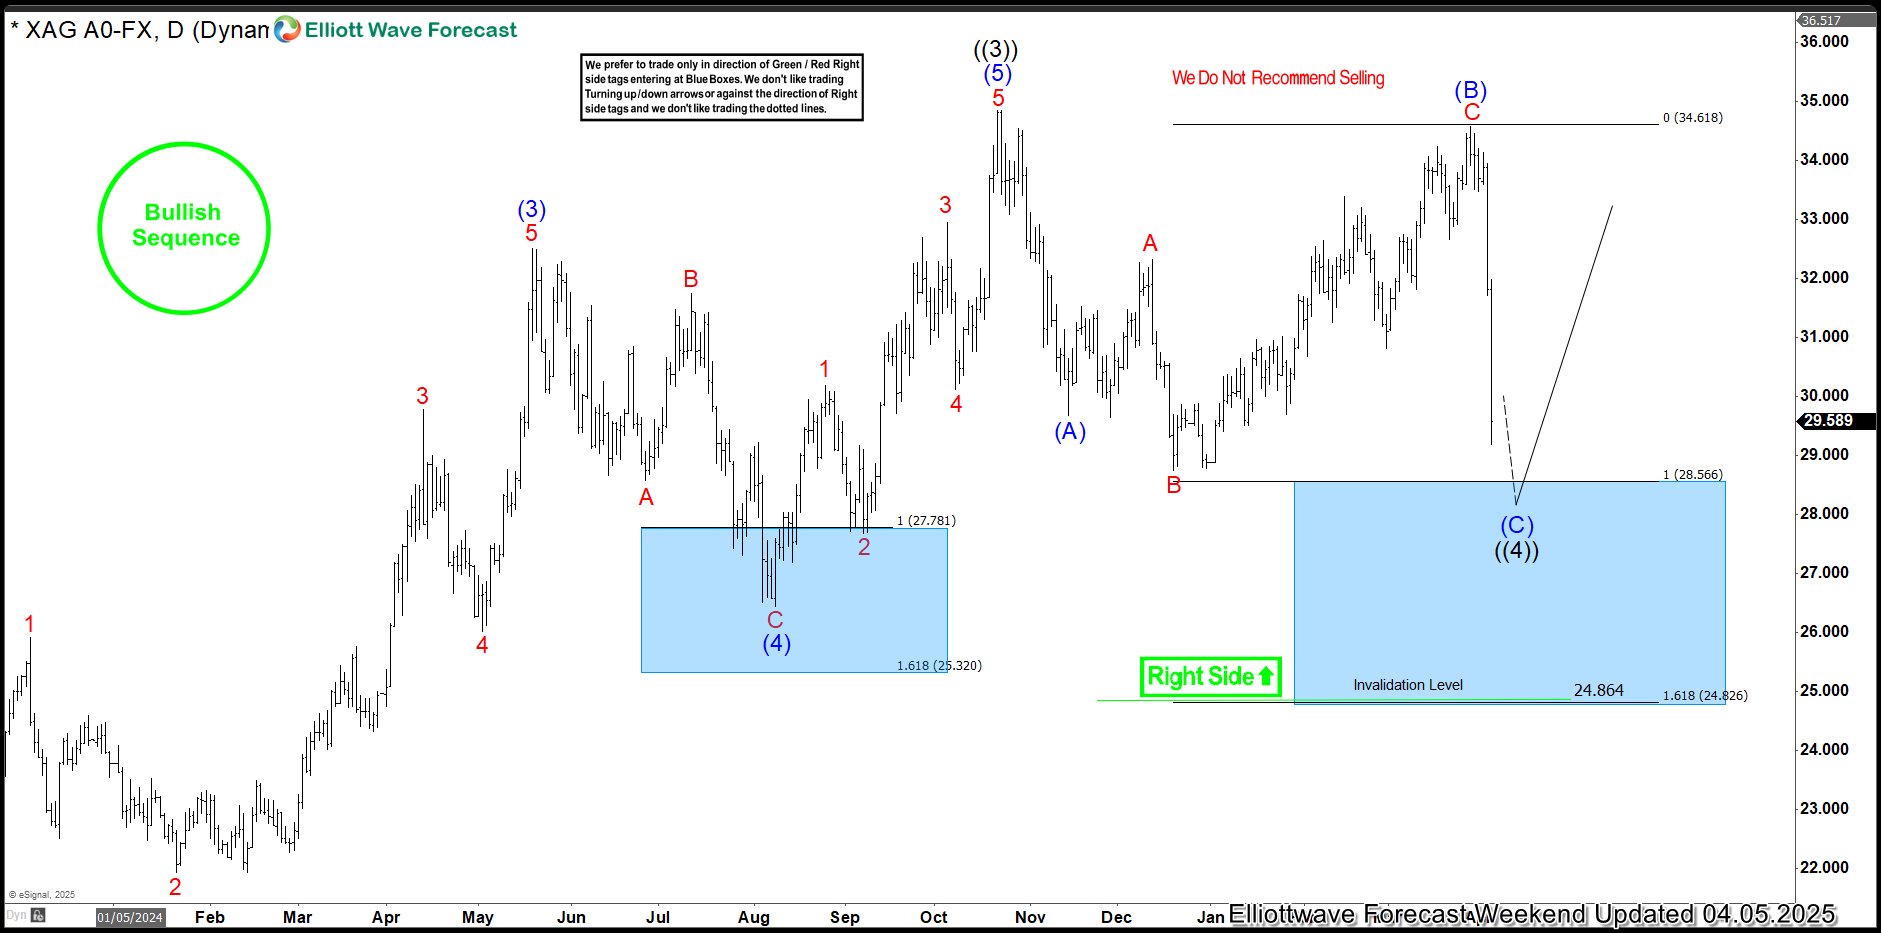
Here are some of the High-Frequency (Blue Boxes) from 2025.
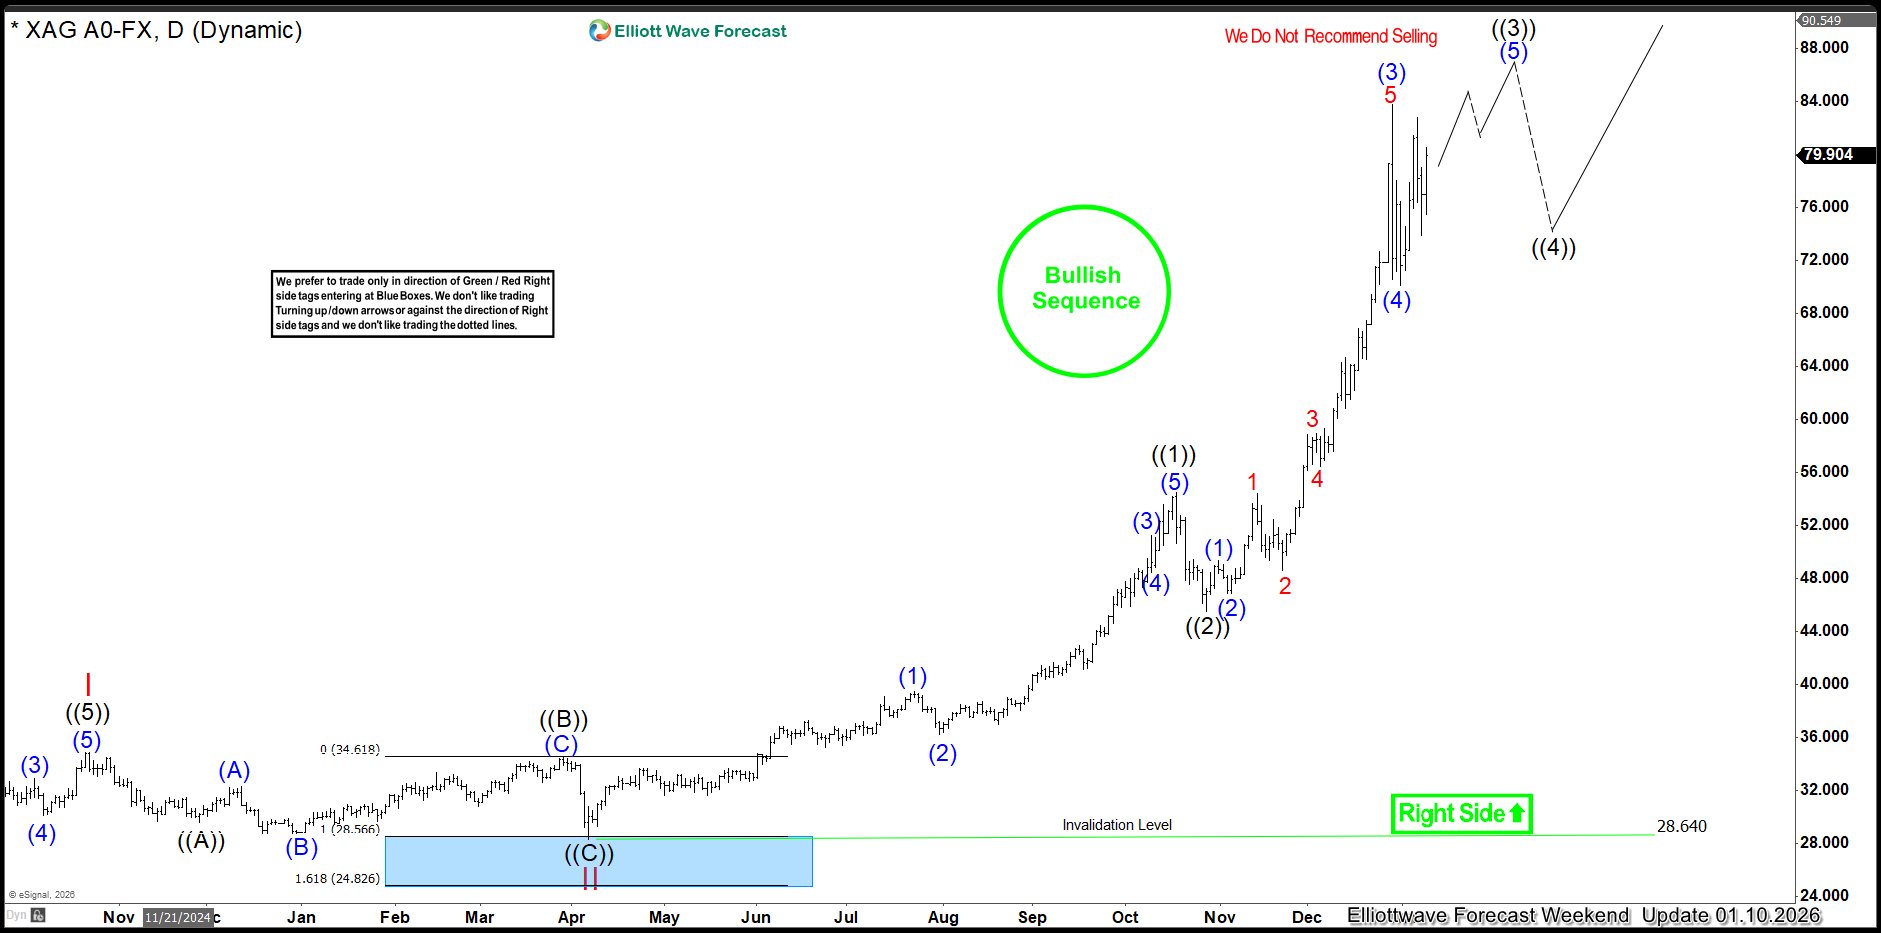
Here is Silver back on 04.05.2025 and Here is Silver now.
Daily Elliott Wave Chart of Silver from 04.05.2025
Daily Elliott Wave Chart of Silver from 01.10.2026
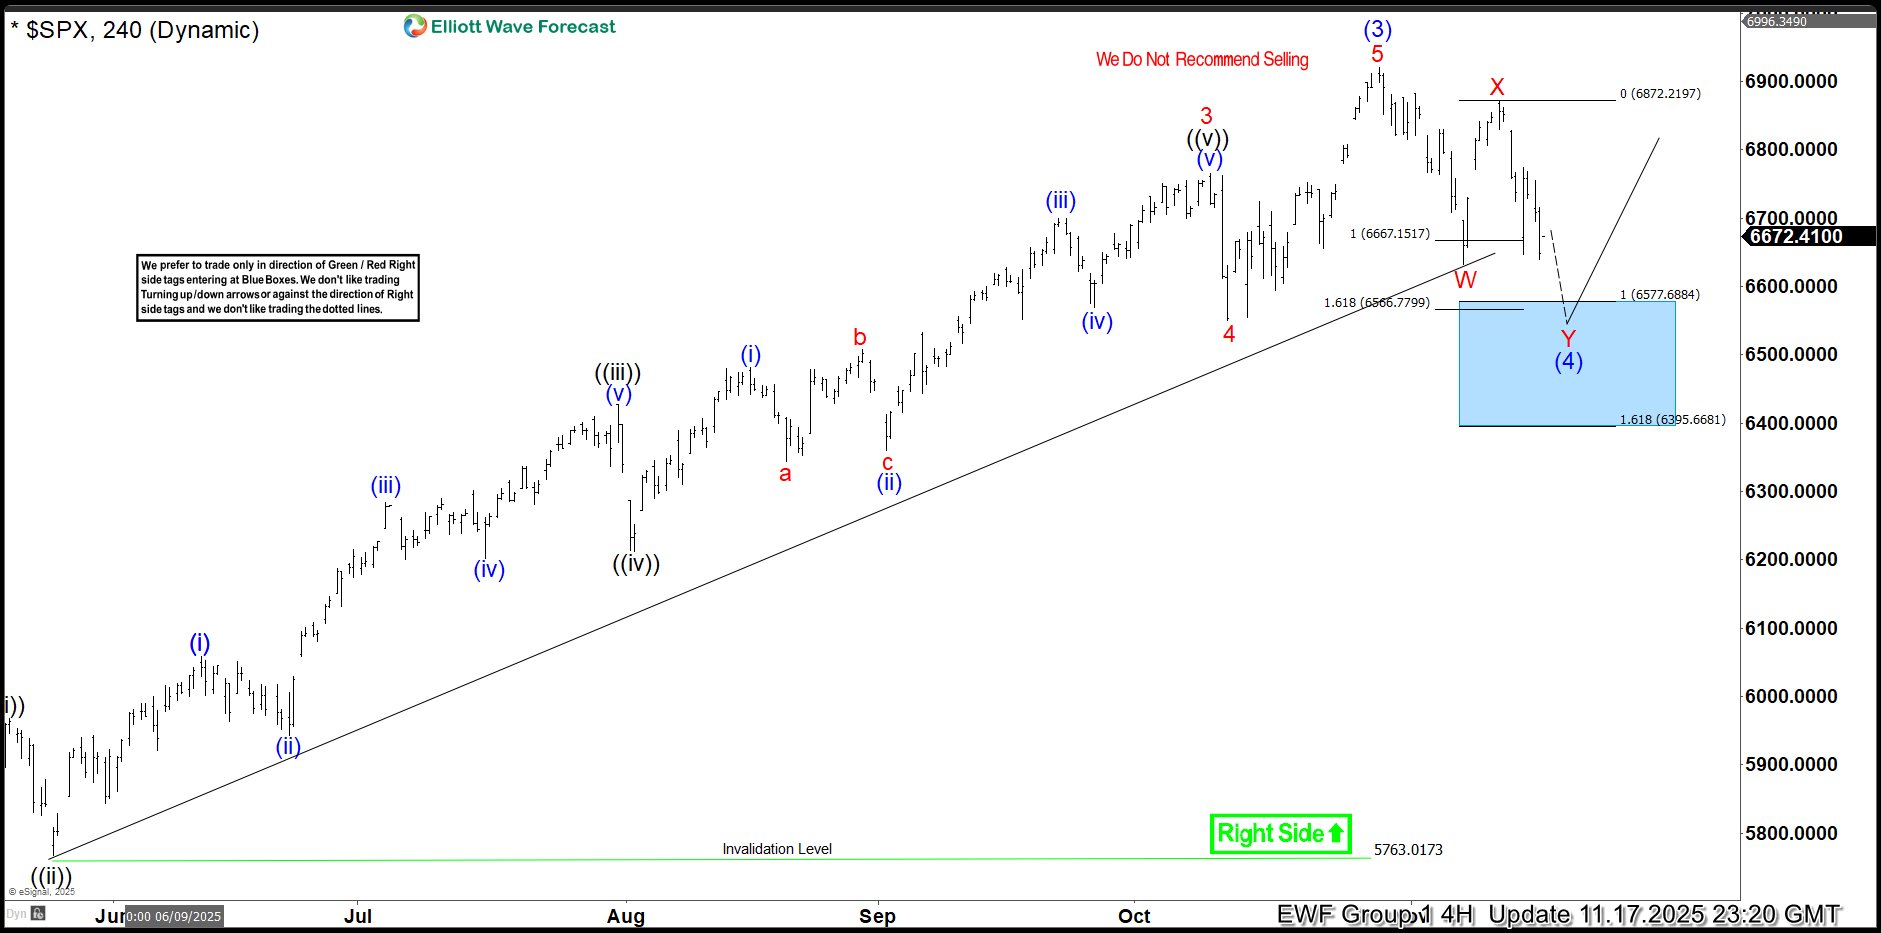
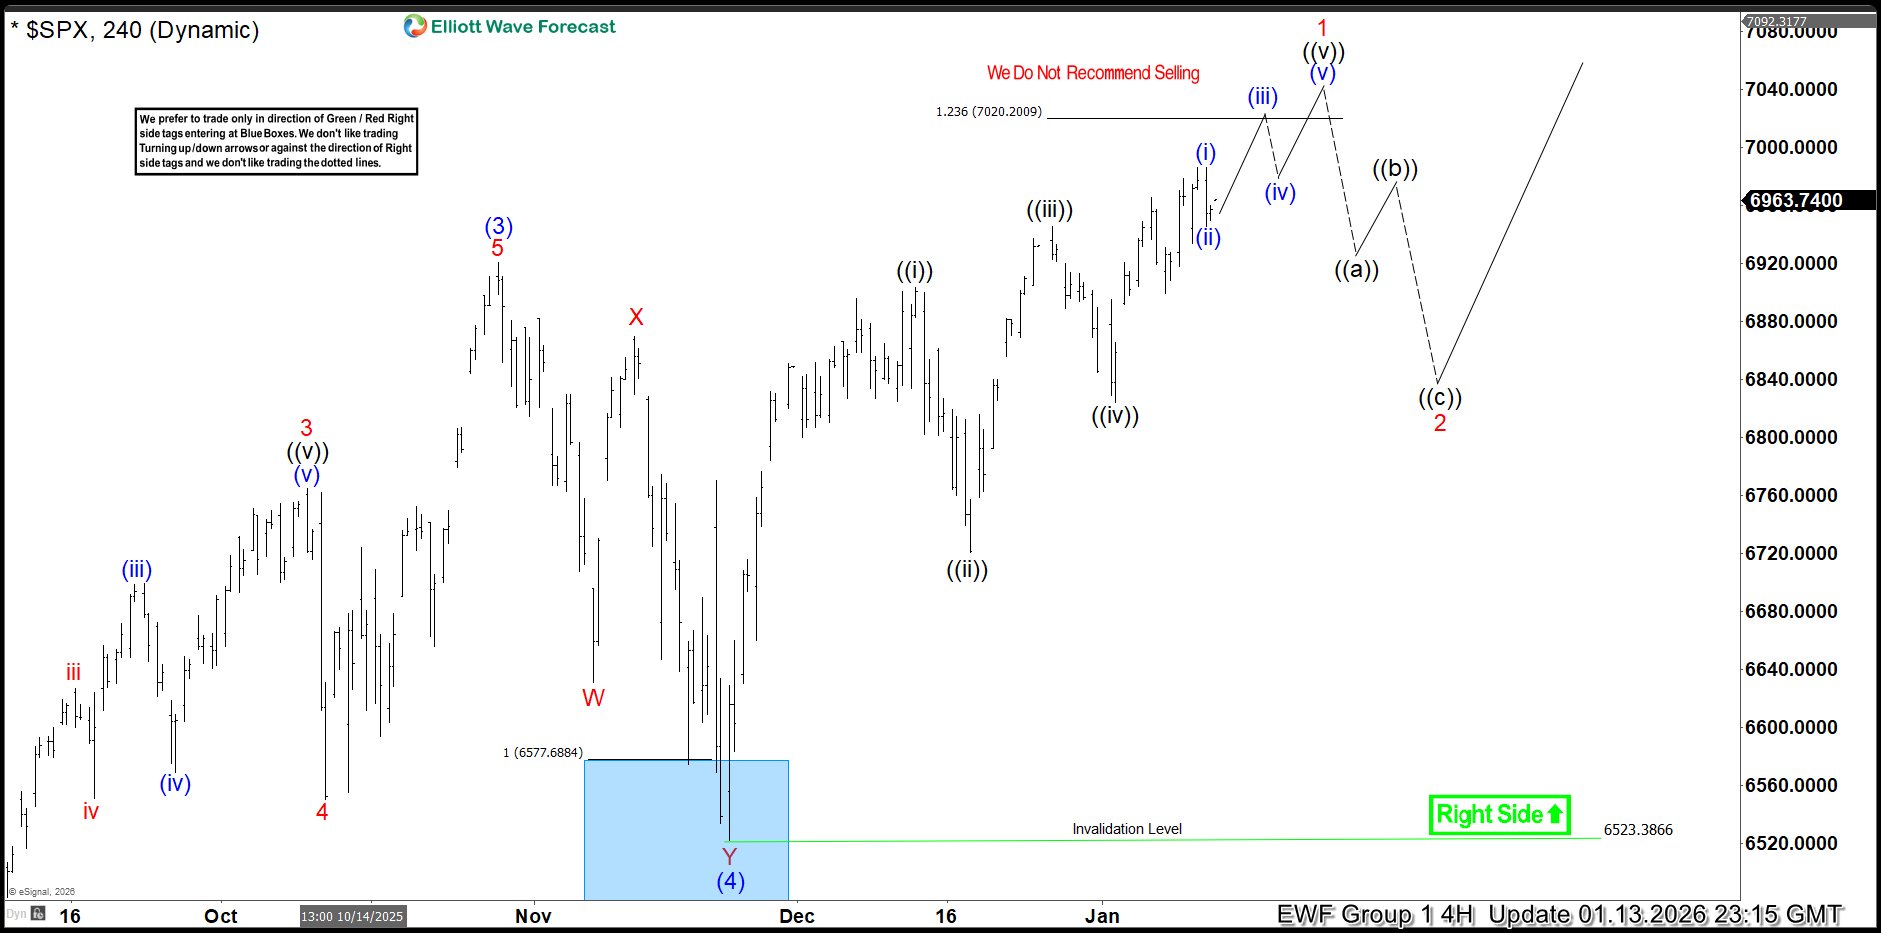
Here is SPX back on 11.21.2025, 4 Hour Time frame and now.
Trading is inherently challenging, and success depends largely on identifying precise entry points and having the confidence to trust those entries. Our approach differs from traditional Elliott Wave services because we have successfully adapted the theory to modern, technology-driven markets. By refining and updating the application of Elliott Wave Theory, we have introduced additional rules to validate or invalidate market structures more effectively.
Our most significant achievement has been the integration of Elliott Wave Theory with high-frequency trading behavior. By aligning classical market psychology with algorithm-driven execution, we have created a framework that reflects how contemporary markets truly operate. This adaptation allows for greater precision, consistency, and relevance in an era dominated by automated trading systems.
Source: https://elliottwave-forecast.com/elliottwave/the-elliott-wave-theory-and-high-frequency-trading/trading/