
Hello fellow traders,
As our members know we have had many profitable trading setups recently. In this technical article, we are going to present another Elliott Wave trading setup we got in American Airlines (AAL) . The stock completed correction precisely at the Equal Legs zone, referred to as the Blue Box Area. In the following sections, we will explain the trading setup in detail and present the targets.
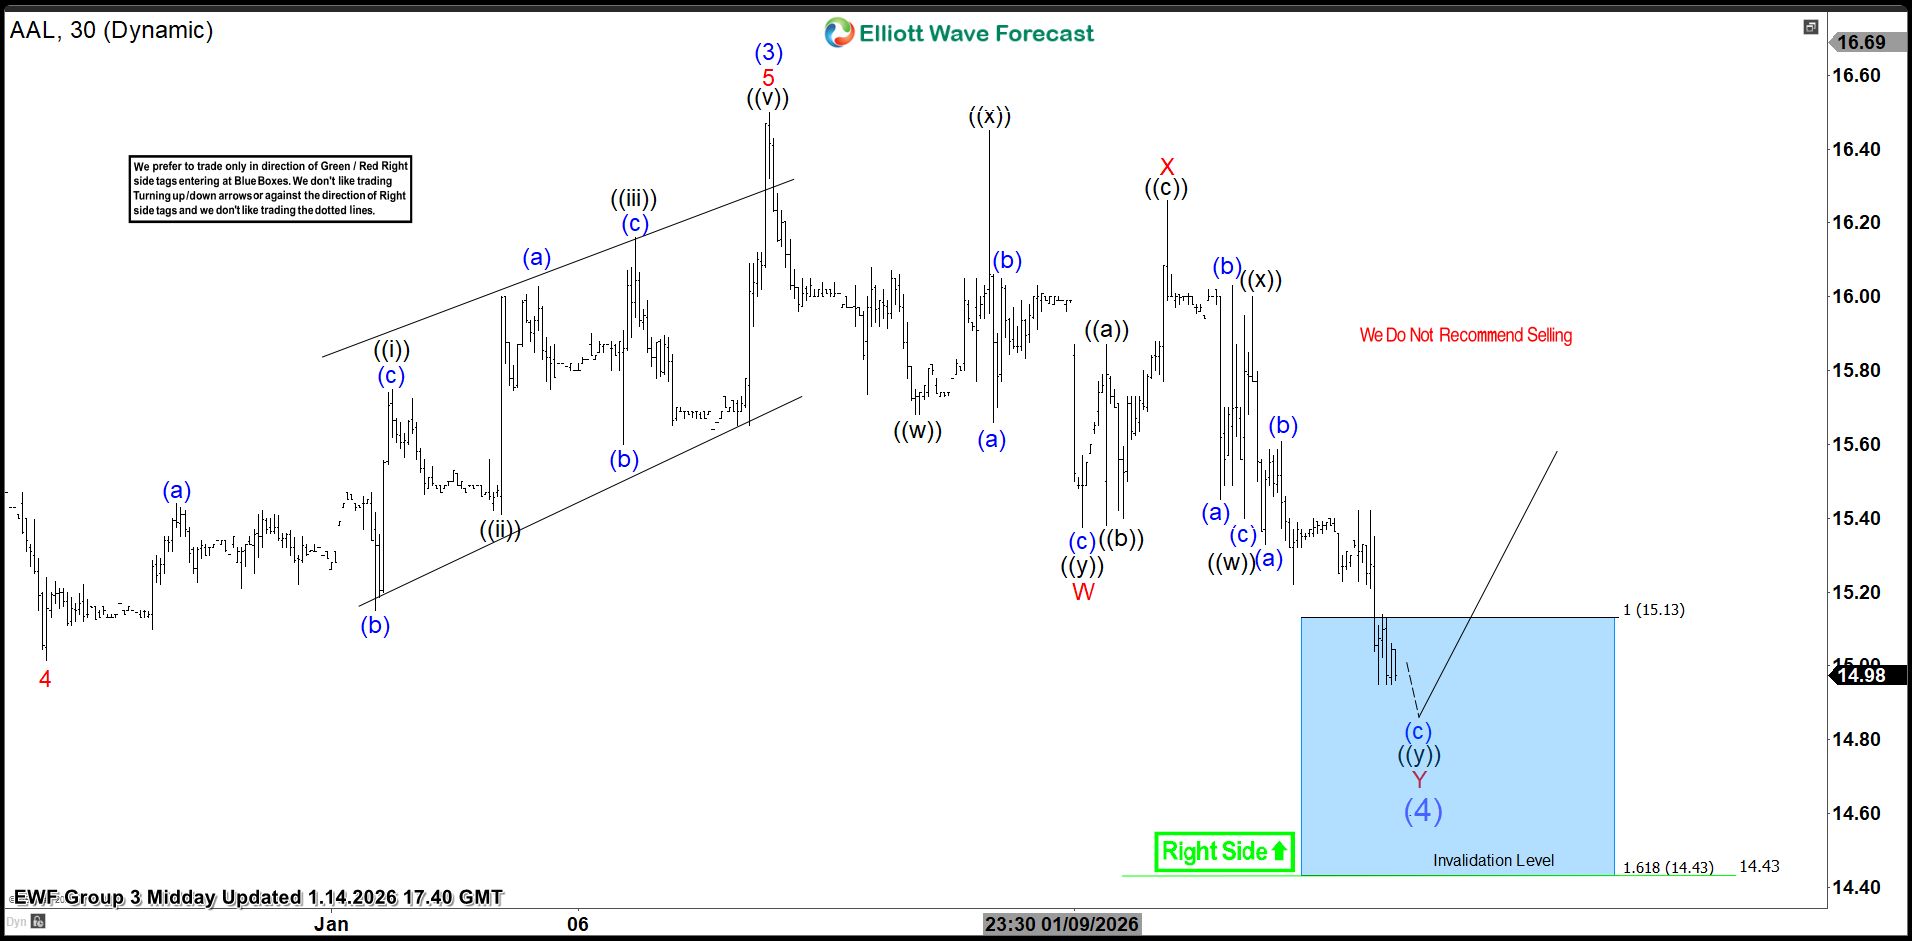
AAL Elliott Wave 4 Hour Asia Chart 1.14.2026
Current view suggests AAL stock is doing wave (4) blue correction. The price has reached extreme zone at 15.13-14.43 (blue box- buying area).
We’re entering long positions within the Blue Box. As the main trend remains bullish, we anticipate at least a 3-wave bounce from this area. Once the price touches the 50 fibs against the B red connector, we’ll make positions risk-free and set the stop loss at breakeven and book partial profits. Breaking below the 1.618 Fibonacci extension level at 14.43 would invalidate the trade.
Official trading strategy on How to trade 3, 7, or 11 swing and equal leg is explained in details in Educational Video, available for members viewing inside the membership area.
Quick reminder on how to trade our charts :
Red bearish stamp+ blue box = Selling Setup
Green bullish stamp+ blue box = Buying Setup
Charts with Black stamps are not tradable. 🚫
Did you know? 90% of traders fail because they don’t understand market patterns. Are you in the top 10%? Test yourself with this advanced Elliott Wave Test
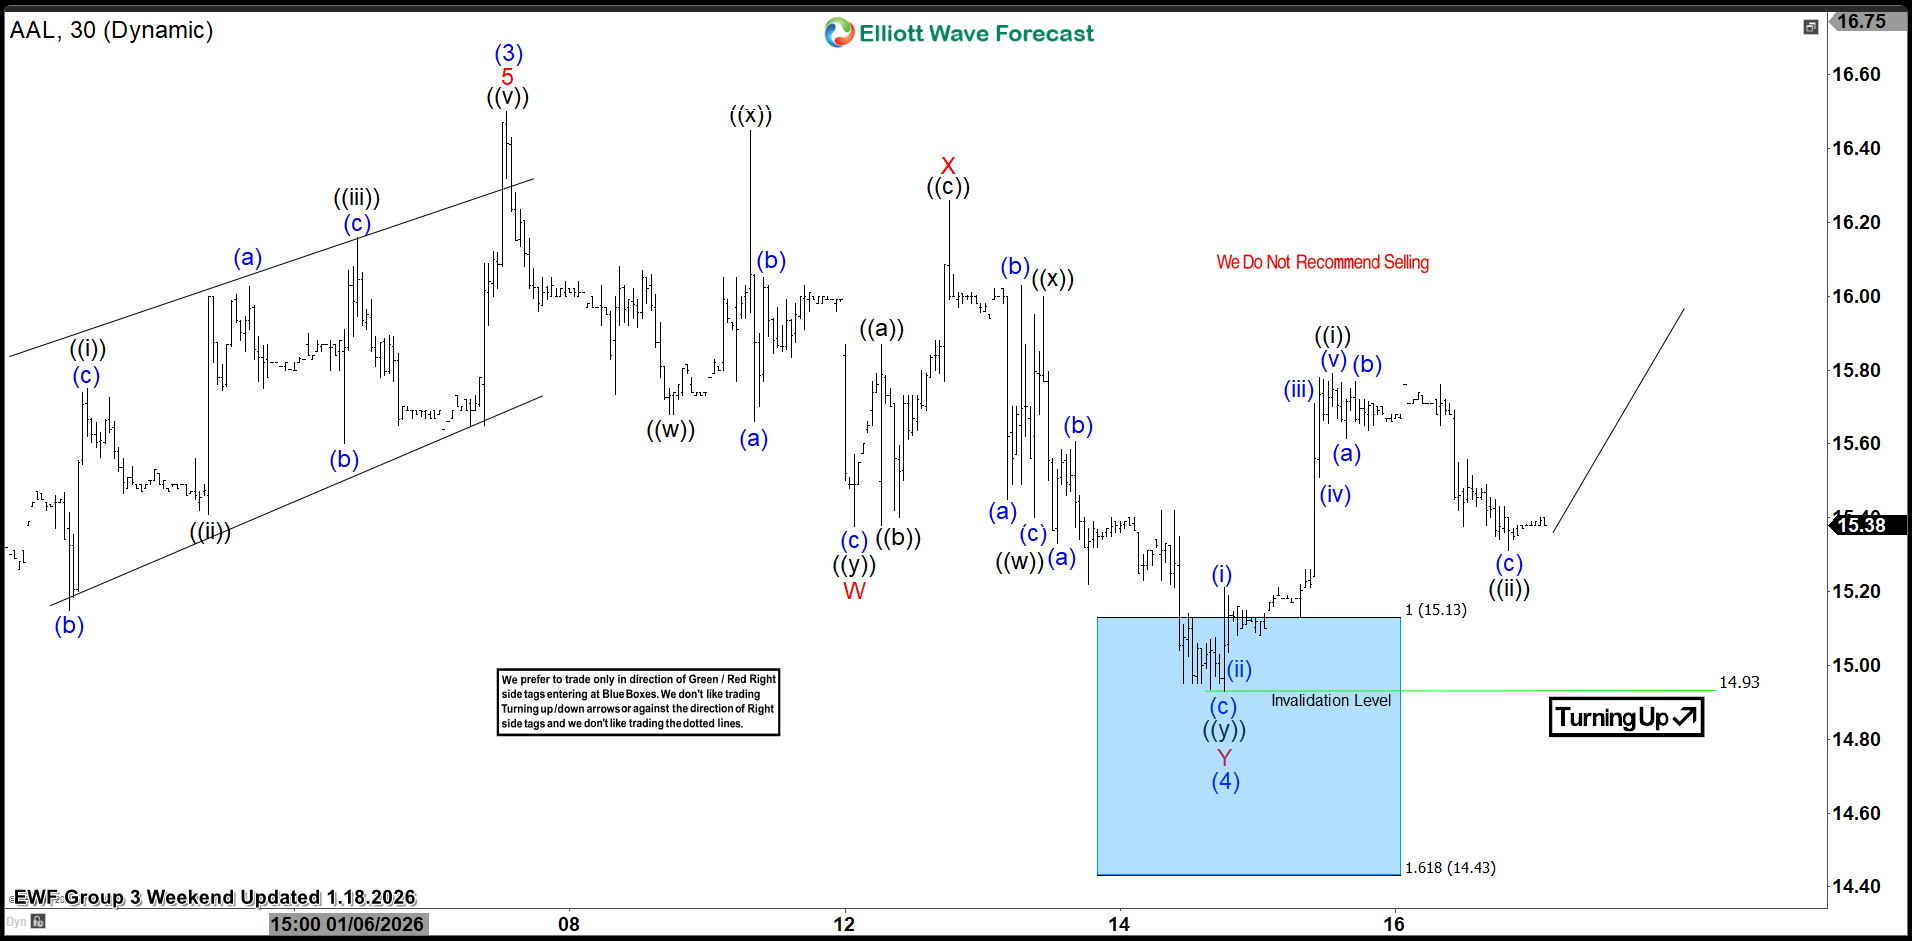
AAL Elliott Wave 4 Hour Asia Chart 1.14.2026
The stock has found buyers as expected and is showing a decent bounce from the Buying Zone which has reached and exceeded 50 fibs against the X red connector. We count the pullback (4) blue as completed at the 14.93 low. Consequently, long positions should now be risk-free. We’ve set our stop loss at breakeven and have already secured partial profits. Now, we would like to see a break of the (3) blue peak to confirm that the next leg up is in progress. While above the 14.93 low, the stock should ideally target the 16.88–17.49 area. Alternatively, if the price breaks 14.93, we will get a deeper pullback, which will allow us to enter long positions again at lower levels.
Keep in mind that market is dynamic and presented view could have changed in the mean time. You can check most recent charts with target levels in the membership area of the site. Best instruments to trade are those having incomplete bullish or bearish swings sequences. We put them in Sequence Report and best among them are shown in the Live Trading Room
Source: https://elliottwave-forecast.com/stock-market/american-airlines-aal-blue-box-2/