Hello fellow traders. In this technical blog we’re going to take a quick look at the Elliott Wave charts of XLK – Technology Select Sector , published at elliottwave-forecast. As our members know XLK has been showing incomplete bullish sequences in the cycle from the August 5th low. Break of the September 12th peak made ETF bullish against the 77.29 low. So we advised members to avoid selling XLK and keep buying the dips in the sequences of 3,7,or 11 swings whenever opportunity presented itself. In further text we’re going to explain Elliott wave Forecast and trading strategy.
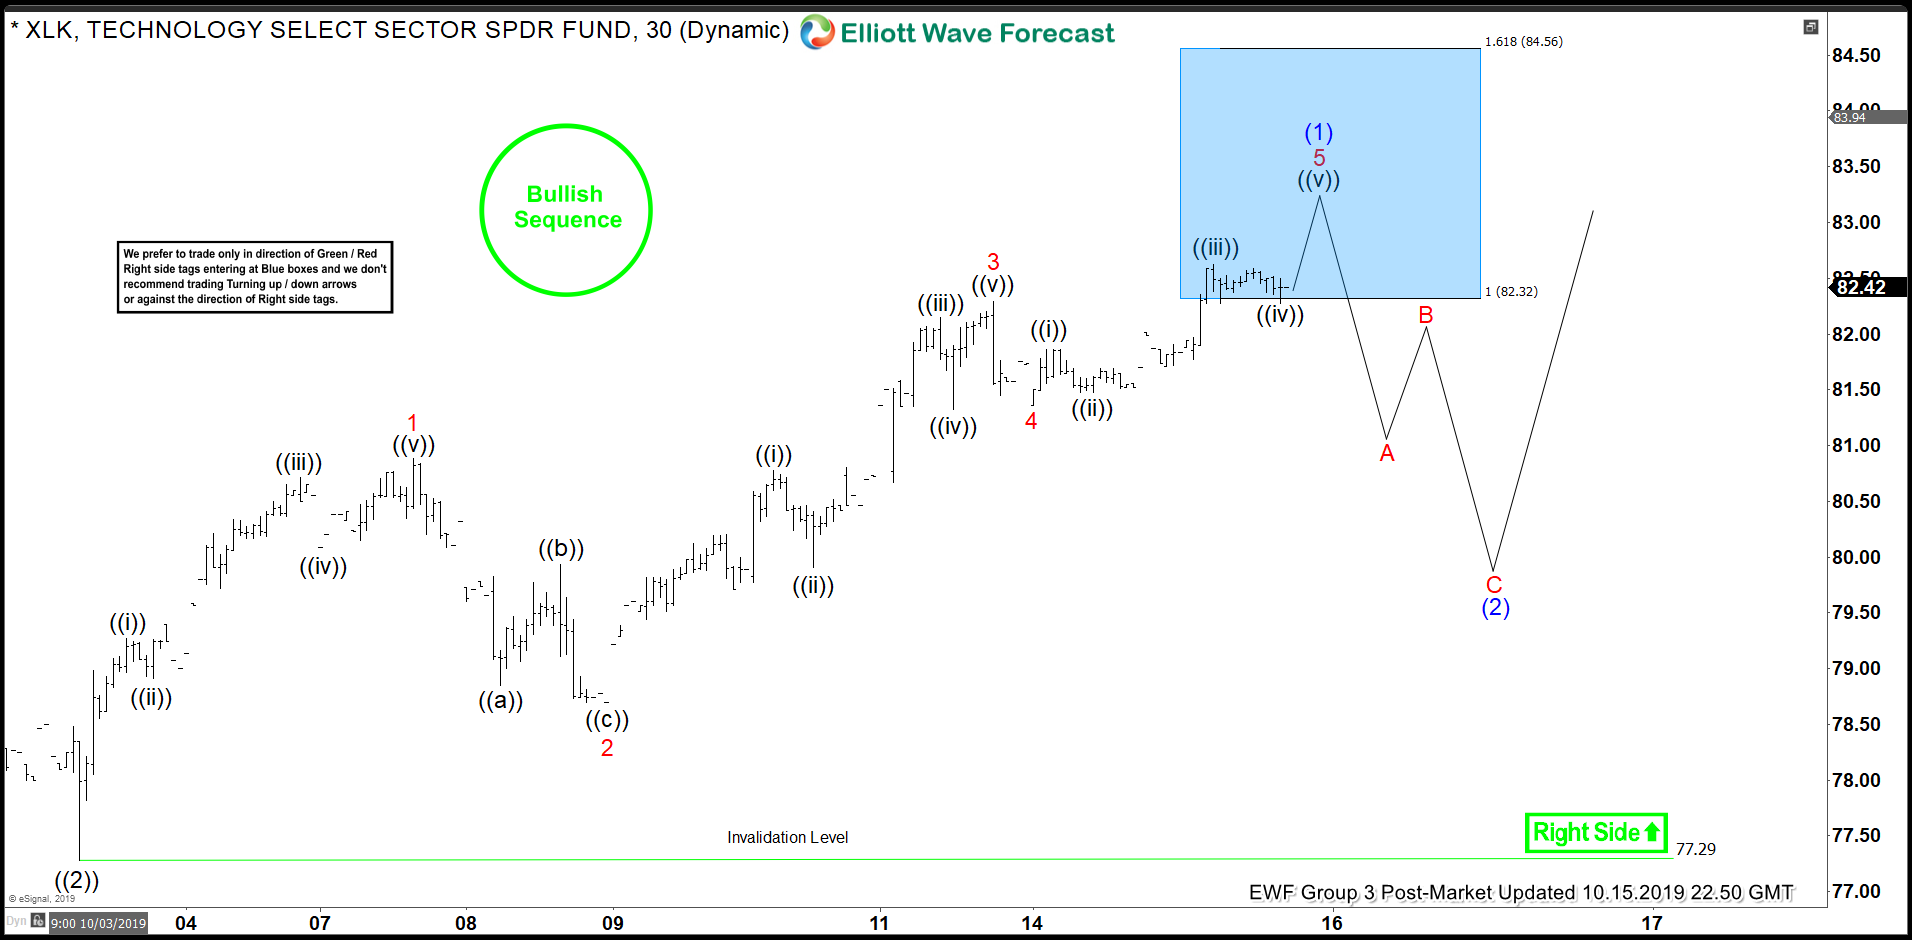
XLK 1 Hour Elliott Wave Analysis 10.15.2019
As we can see on the chart below, the cycle from the 77.29 low is unfolding as a 5 waves structure. The price has already reached important technical area- blue box where buyers will be taking profits. We don’t recommend forcing the trades at this moment. We don’t like buying it at this stage as the price is already at the extremes from the lows and cycle can complete any moment. On other hand don’t like selling as the main trend is bullish. Strategy is waiting for clear 3 waves pull back against the 77.29 low, before we resume buying the dips again in 3,7,11 swings sequences.
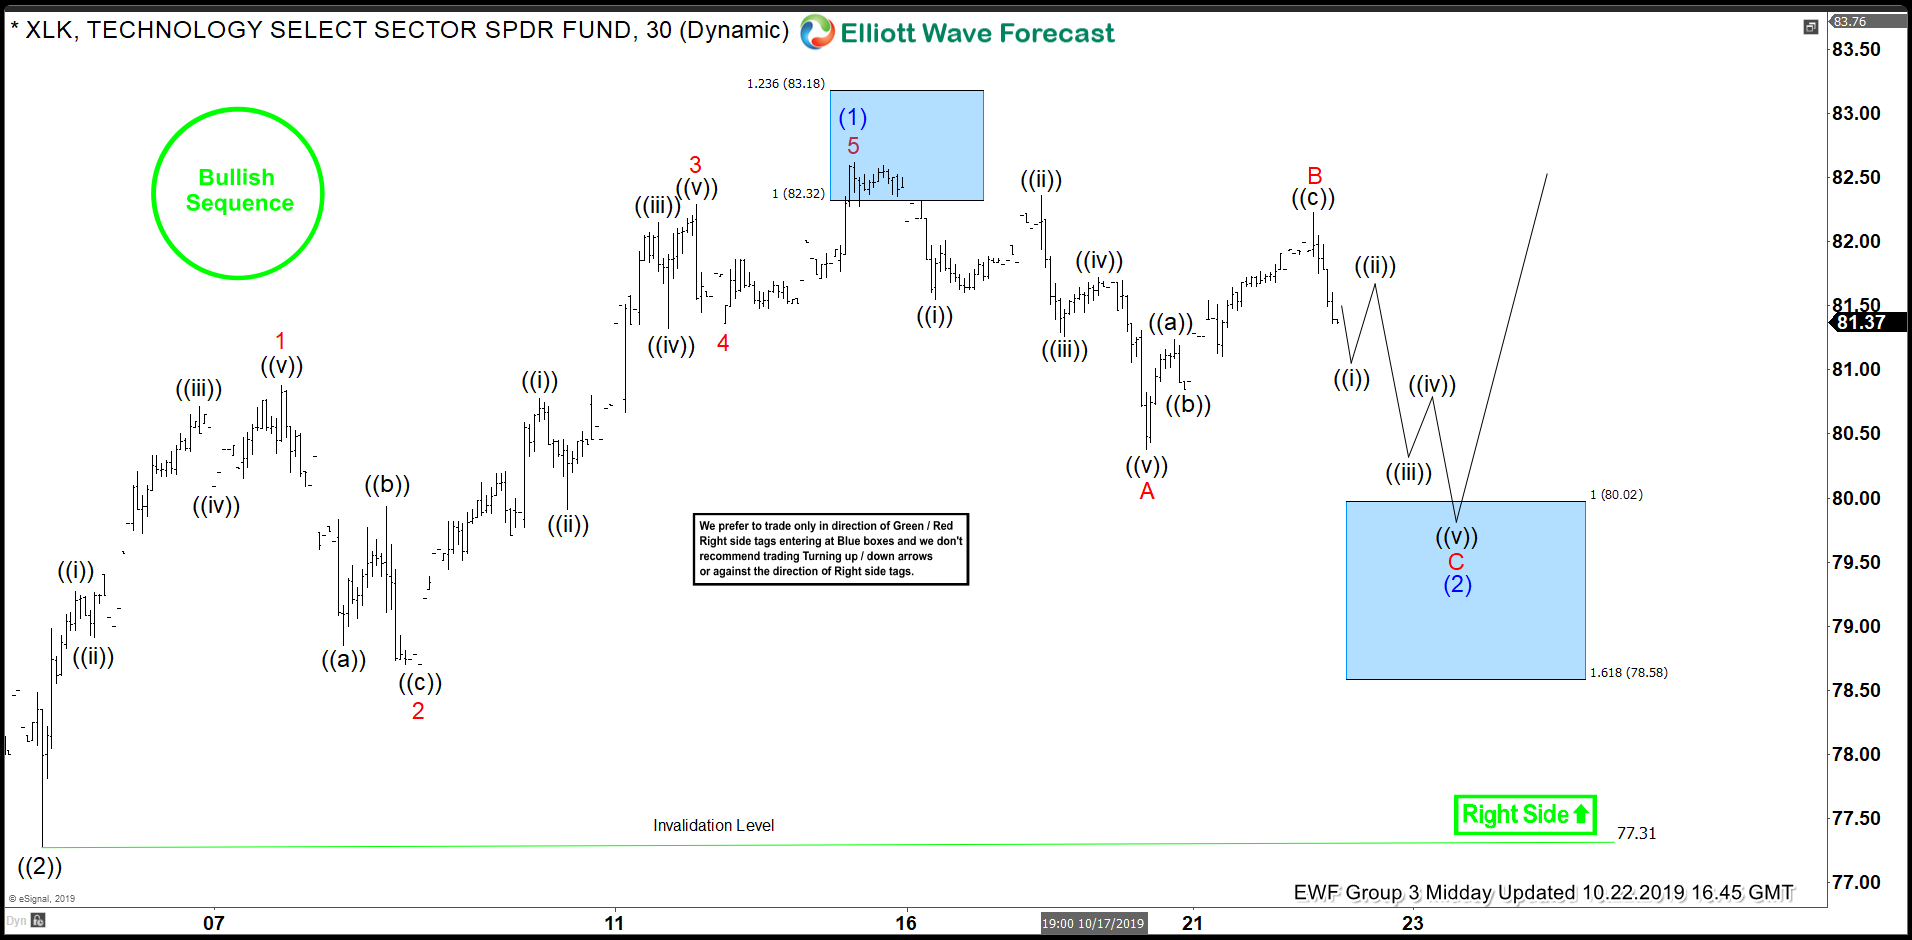
XLK 1 Hour Elliott Wave Analysis 10.22.2019
Cycle ended right at the Blue Box area:82.32-83.18 and we are getting pull back-wave (2) blue . We got 5 waves down from the wave (1) blue peak. So, we are assuming that pull back is unfolding as Elliott Wave Zig Zag Pattern. Decline from the peak was only the first leg A red of wave (2) blue pull back. As far as the price stays below B red short term high, and more importantly pivot at 10/15 high holds , we can get another leg down toward Blue Box area: 80.02- 78.58 . At mentioned area we like to be buyers for proposed rally or 3 wave bounce alternatively.
As our members know, Blue Boxes are no enemy areas , giving us 85% chance to get a bounce. The main trend is bullish and we expect to see reaction in 3 waves up from the blue box at least.
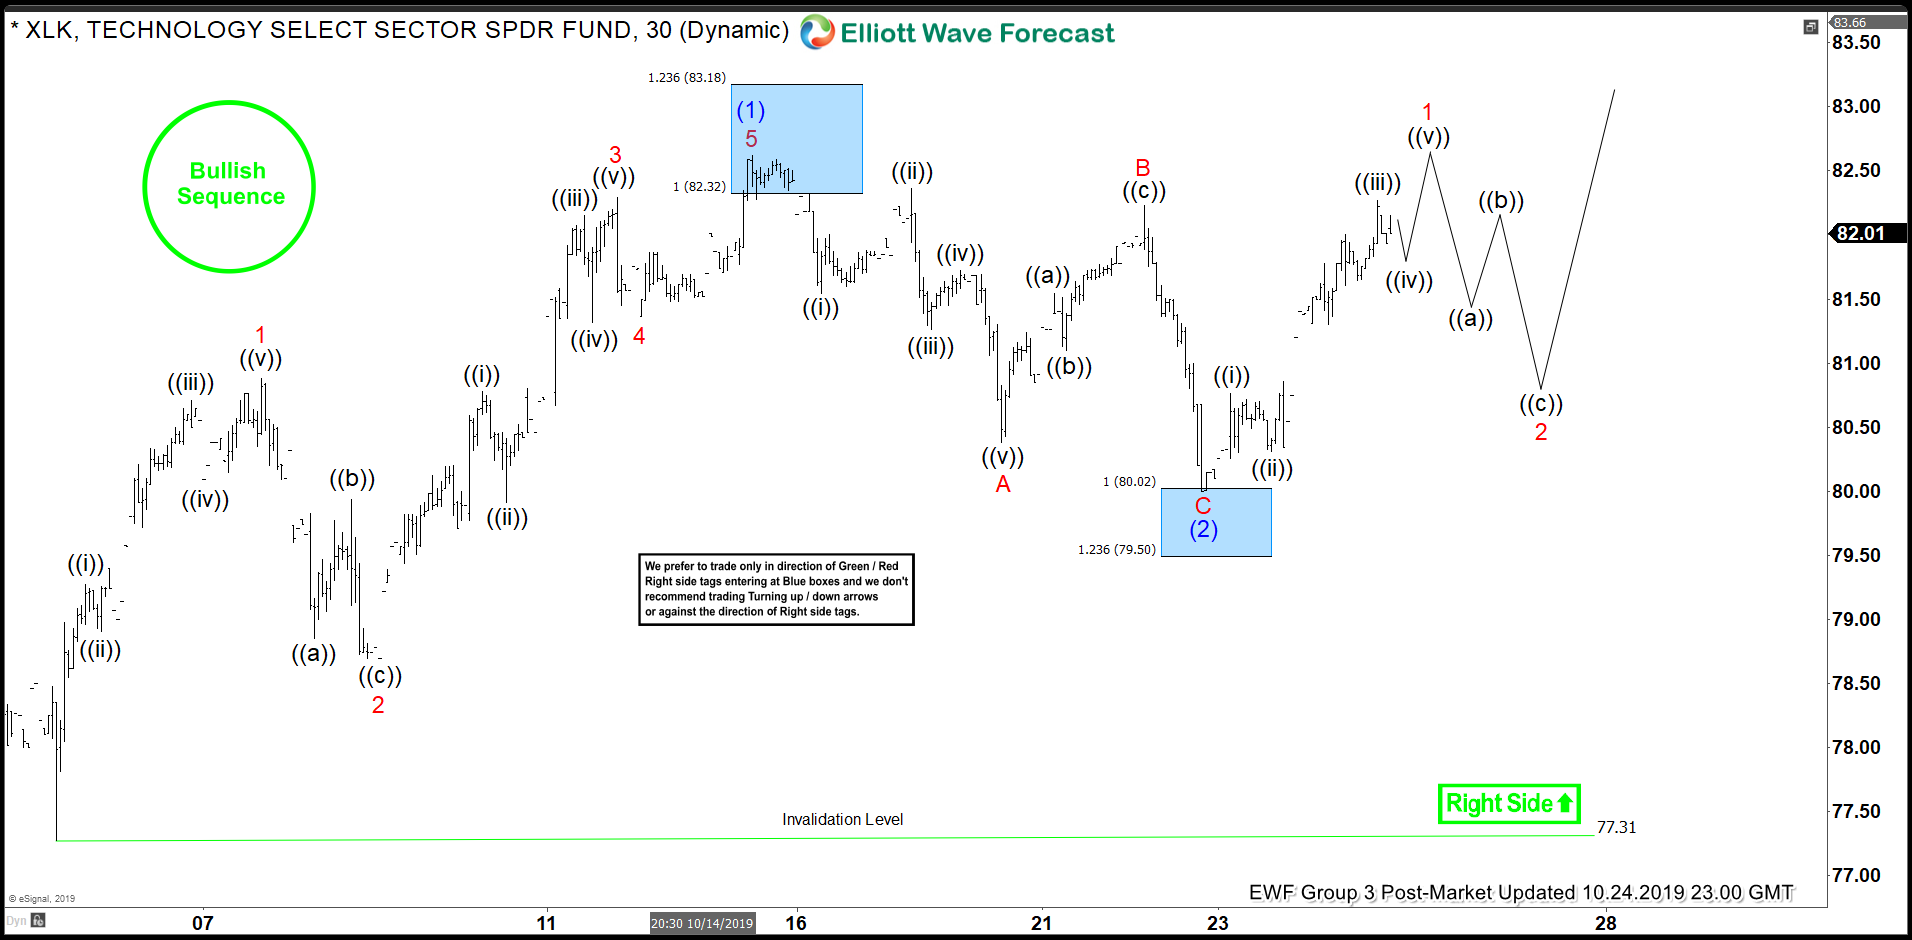
XLK 1 Hour Elliott Wave Analysis 10.24.2019
Eventually we got proposed leg down toward buying zone: 80.02-79.5. Buyers appeared right at the blue box and the price made decent bounce so far. As a result members are now enjoying profits in risk free positions. Now, we would like to see break of wave (1) blue high to confirm next leg up is in progress.
Keep in mind that market is dynamic and presented view could have changed in the mean time. Best instruments to trade are those having incomplete bullish or bearish swings sequences. We put them in Sequence Report and best among them are shown in the Live Trading Room. You can check most recent charts in the membership area of the site.