
FXC Canadian Dollar Trust Long Term Cycles & Elliott Wave
Firstly the FXC instrument inception date was 6/26/2006. The instrument tracks changes of the value of the Canadian dollar relative to the U.S. dollar. It increases in value when the ‘loonie’ strengthens and declines when the dollar appreciates. In January 2002 the USDCAD forex pair made an all time high at 1.6184. Then it saw a decline into the November 2007 lows at .9059 where it is thought to have ended correcting the cycle up from the all time lows. That translates to the 113.02 price high from November 2007 in FXC that should prove to be a long term cycle high. This was an upward correction of an even larger cycle that should be down in the case of this instrument. This is where the analysis begins on the FXC monthly chart shown below. The analysis continues below the FXC Monthly chart.
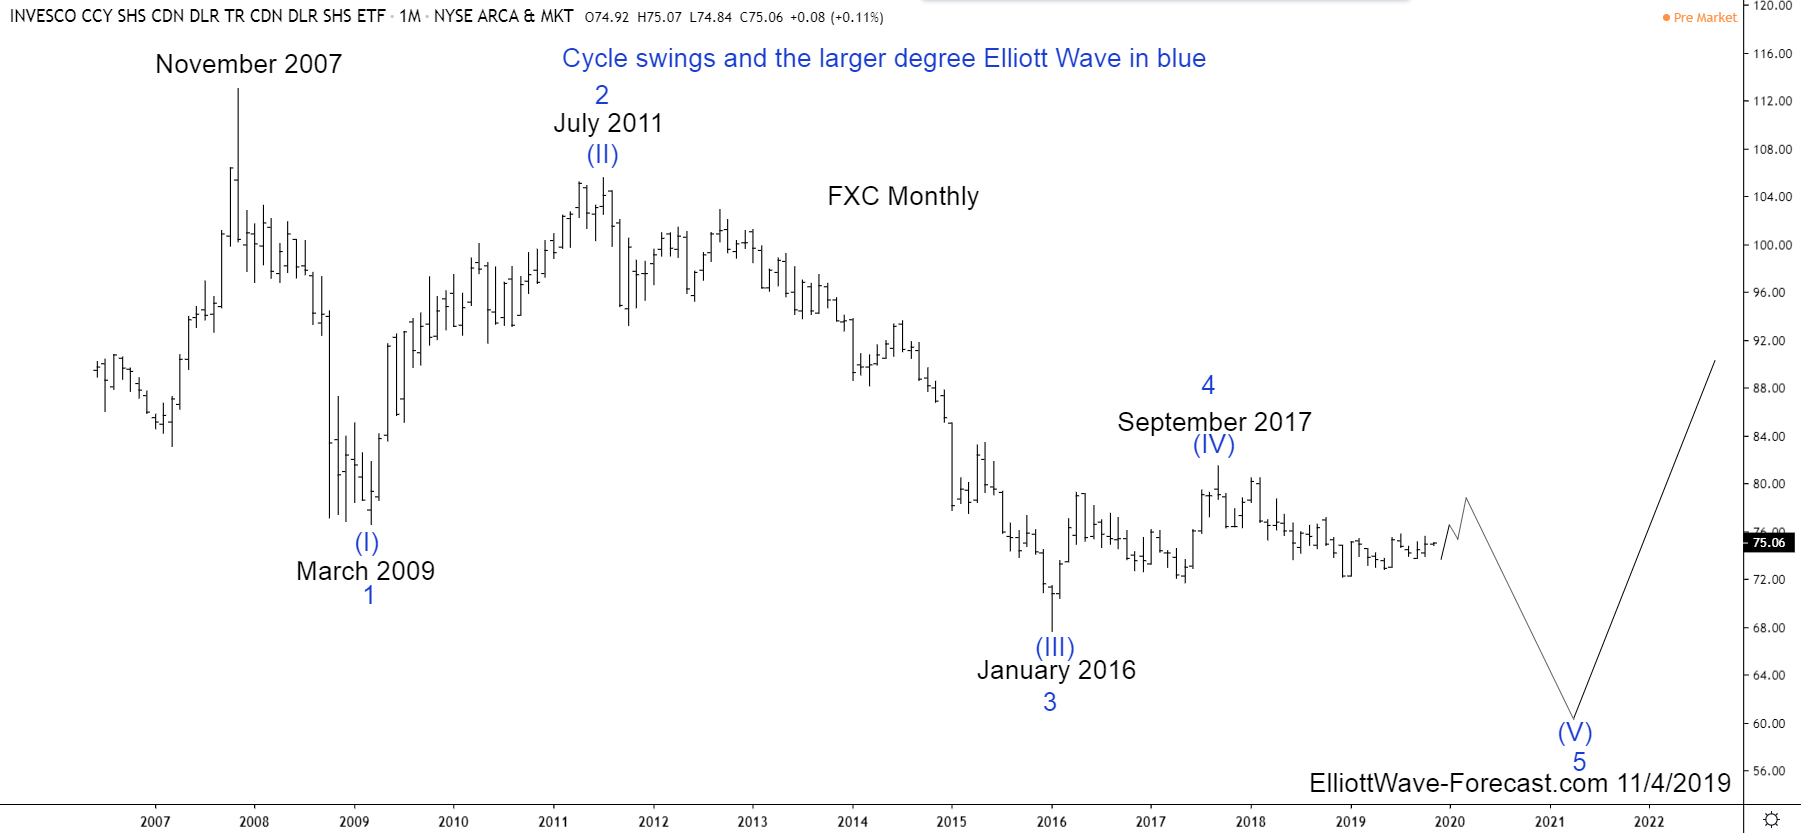
Secondly as previously suggested the FXC instrument mirrors USDCAD price highs and lows inversely. The decline from the November 2007 highs in FXC appears to be an incomplete Elliott Wave five wave impulse although it does have some price overlap as would a diagonal. The wave (III) ended in January 2016 then saw a zig zag wave structure that ended in September 2017 correct the cycle from the July 2011 highs. The analysis and conclusion continues below the FXC Weekly chart.
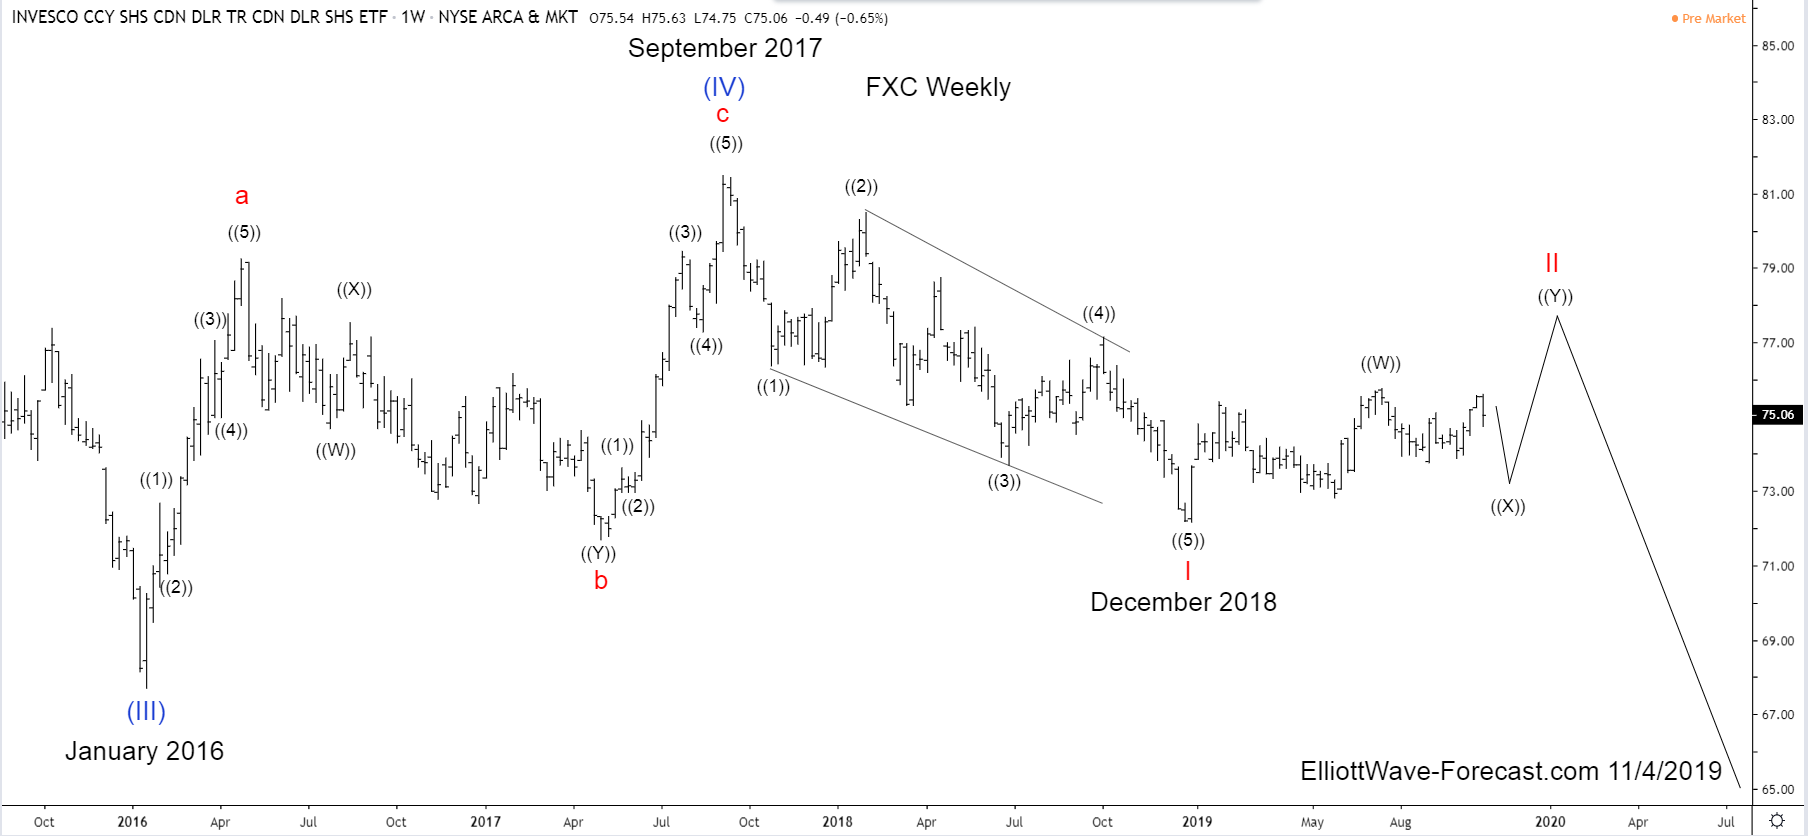
In conclusion: As the FXC weekly chart suggests, the instrument ended a larger cycle lower in wave I at the December 2018 lows. That cycle subdivides best as 3 swings in each of the ((1))-((3)) & ((5)) waves as would a diagonal. From the December 2018 lows, the instrument shows 3 swings higher in a wave ((W)) that ended July 2019. While below there it can see a swing lower in wave ((X)) toward 73.65-73.18. This needs to end before a Fibonacci extension area for wave ((Y)) of II can be defined. I will update this instrument’s price movement later when this happens with the defined area for the wave II correcting the cycle lower from the September 2018 highs. Generally a 50% to 61.8% Fibonacci retracement is about right for a wave two in any degree. While price is above the December 2018 lows that area is 76.84-77.94.