
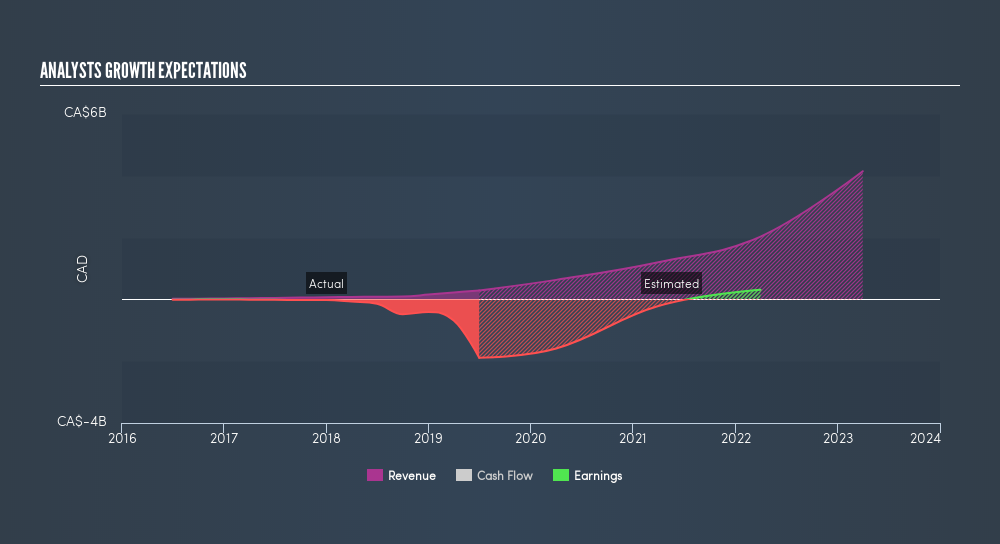
The world’s largest medical cannabis producer by market cap, Canopy Growth (NYSE : CGC) reported earning two weeks ago. While revenue surged by nearly 250% year over year to 90.5 million Canadian dollars, it was down 59% from the previous quarter and more than 20 million Canadian dollars below the average analyst estimate which raised some concerns.
The company managed to sell a total of 10,549 kilograms of product, compared to 9,362 in Q4 and harvested 40,960 kilos, up 323% from the year-ago period’s 9,685 kilo. The harvest was bigger than the 34,000 kilos that management had projected and it should translate to higher sales in the coming quarters.
Analyst are still optimist about Canopy growth expectation as the company is set to launch a variety of products, including cannabis-infused beverages, edibles, and vapes which is expected to find good demand in US and worldwide.
Canopy Growth Expectations
The technical picture for Canopy is clear in the weekly chart using Elliott Wave Theory to identify the current structure taking place :
Since IPO, CGC rallied higher 1600% in an impulsive 5 waves advance before ending that cycle last year at October peak $59.25 . Down from there, the stock started a classical 3 waves zigzag structure which remain in progress after breaking December 2018 low and aiming for the equal legs area $18.74 – $10.72 which is expected to find buyers at least for a 3 waves bounce from there.
Only a break above 2018 peak will confirm the start of a new bullish cycle higher so until that happens, the stock can remain trapped in a sideways range after bouncing from the blue box area or even do a double correction lower at a later stage.
Canopy Growth CGC Weekly Chart 08.26.2019
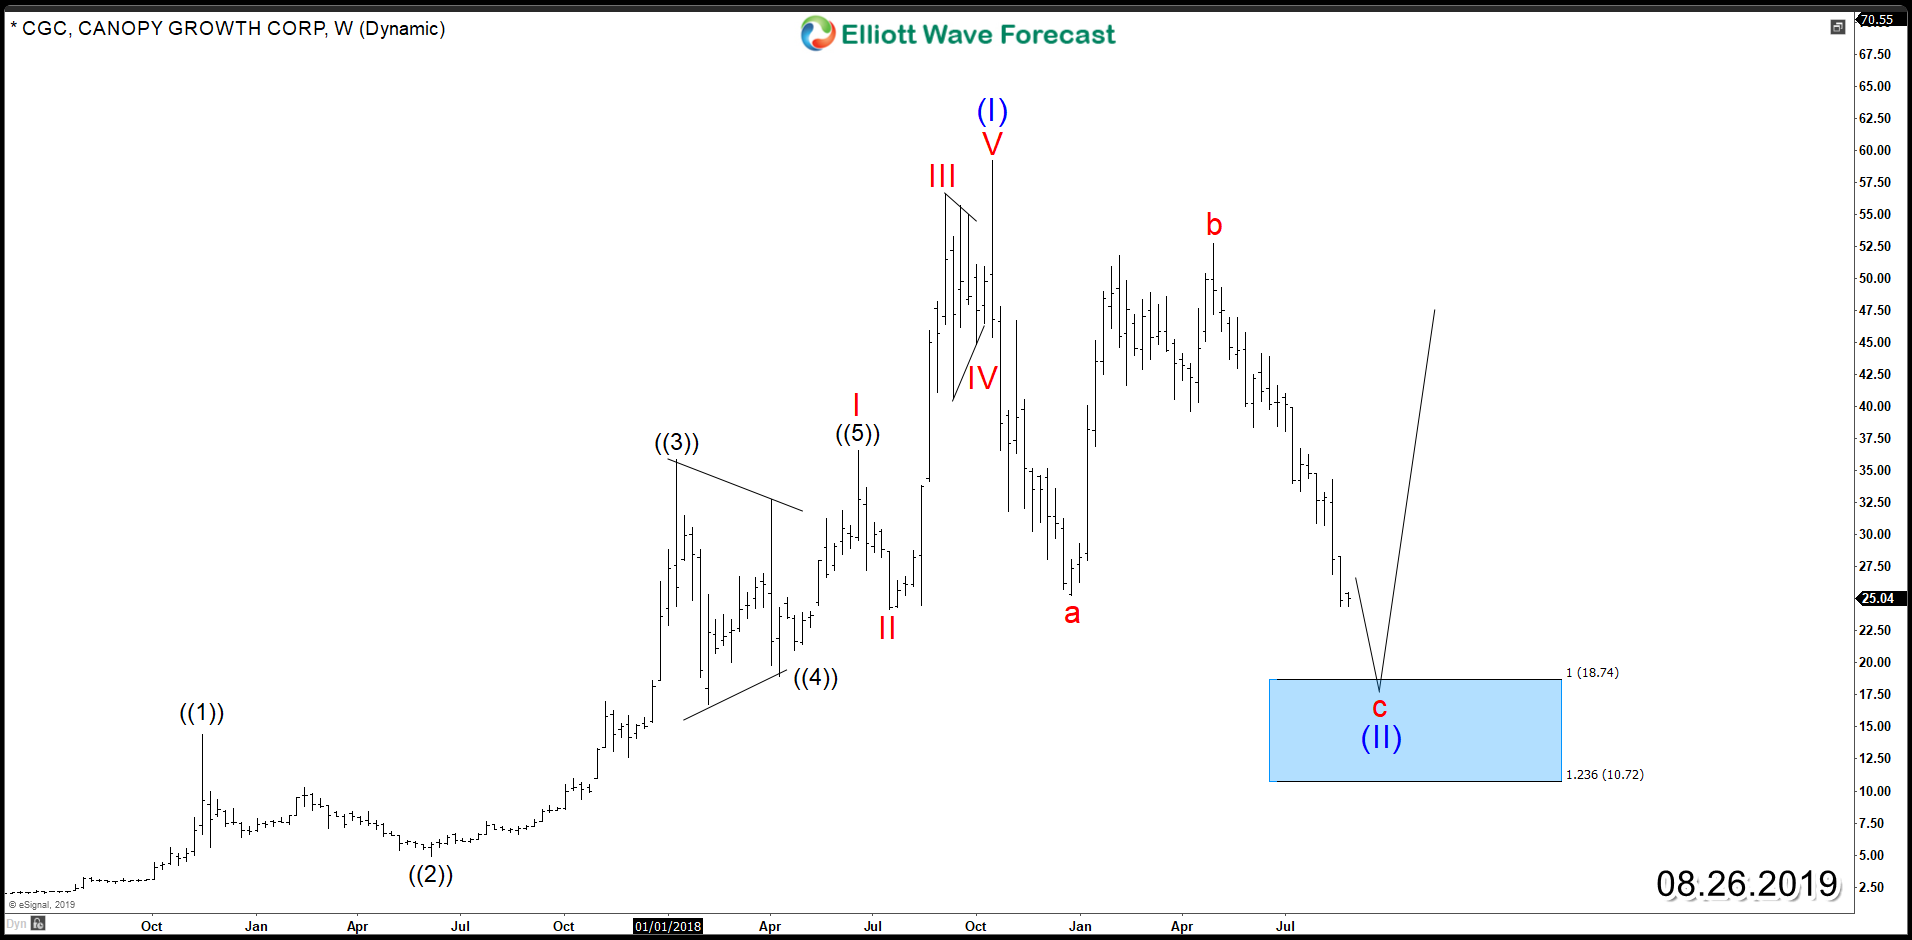
The blue boxes in our charts are the High-frequency areas where the market is likely to end cycles and make a turn. Consequently, CGC will provide a long term investment opportunity based on the technical extreme area provided in the above chart and also based on the optimistic expectation about the company which is looking to keep expanding.