US Dollar has been rallying strongly against Swedish Krona and Singapore Dollar for the past couple of months and have broken above significant peaks so in this blog, we would take a look at the cycles and sequences in USDSEK and USDSGD and present the next targets and also talk about what this means for US Dollar Index.
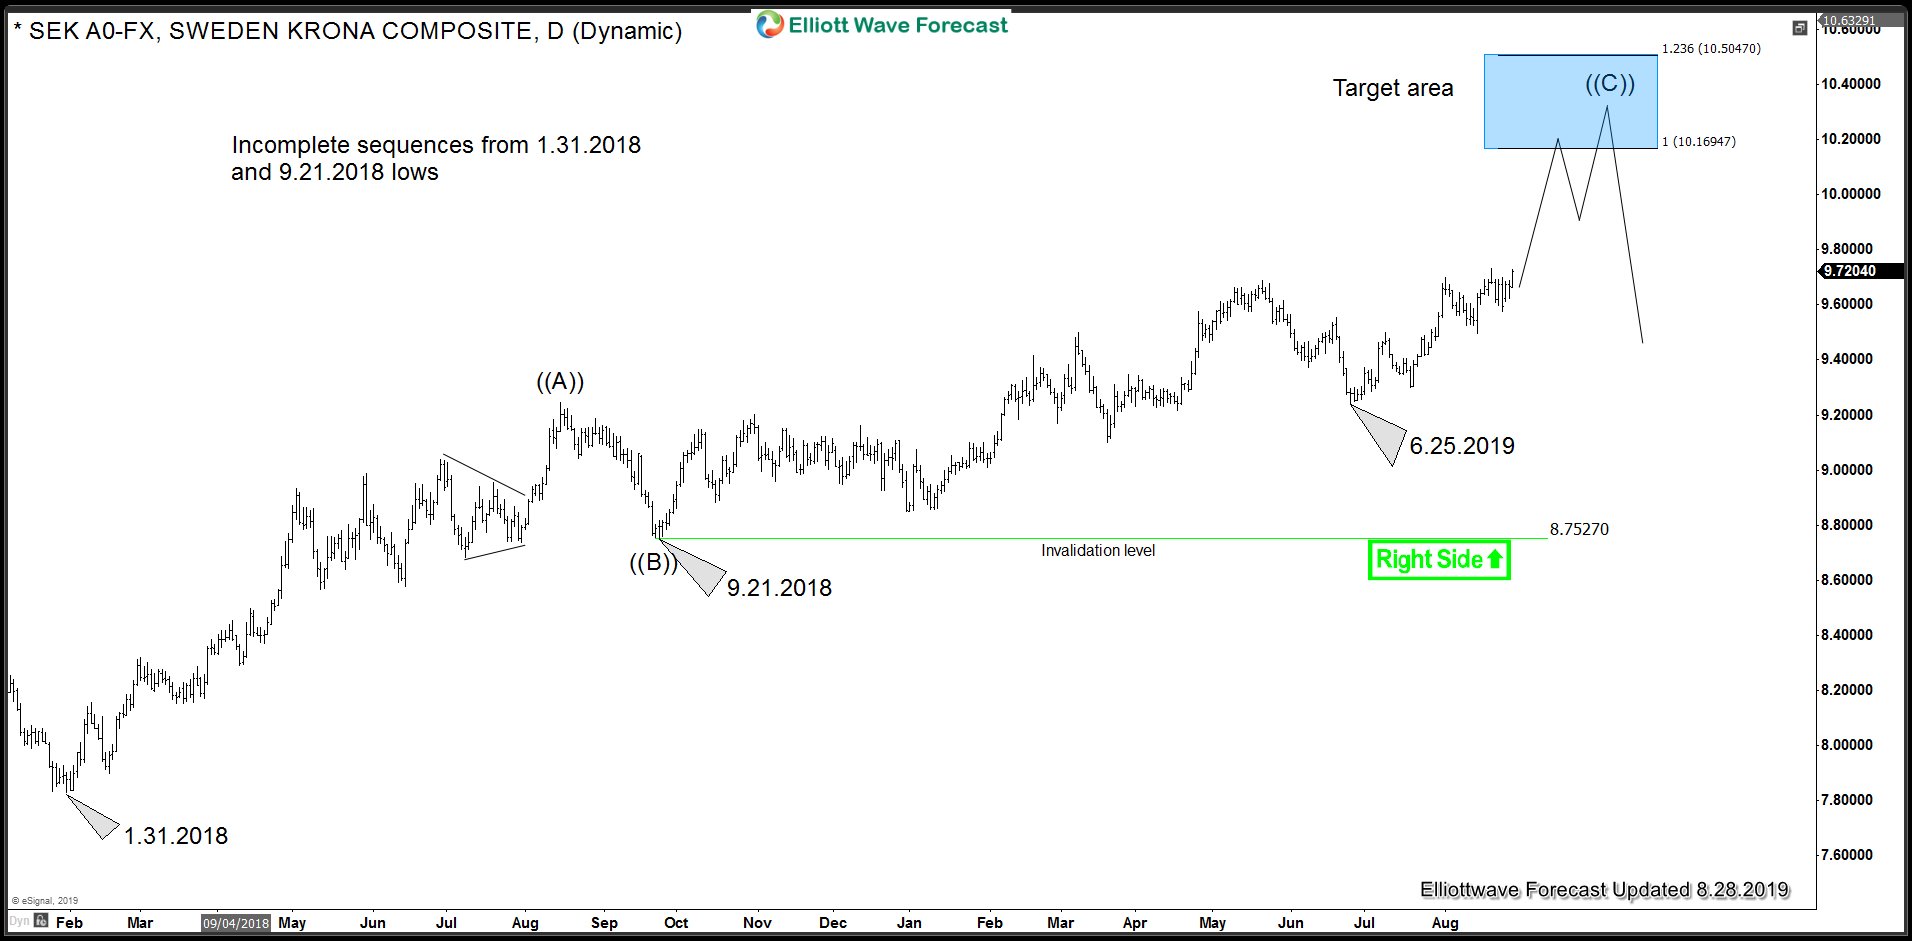
USDSEK (Swedish Krona) Cycle and Sequence from 1.31.2018
Chart below shows pair has recently broken above May 2019 peak and now showing incomplete bullish sequence from 1.31.2018 low against 9.21.2018 low and also from 9.21.2018 low against 6.25.2019 low. As far as dips hold above 6.25.2019 low, expect the rally to continue towards target area between 10.1694 – 10.5047 highlighted with a blue box.
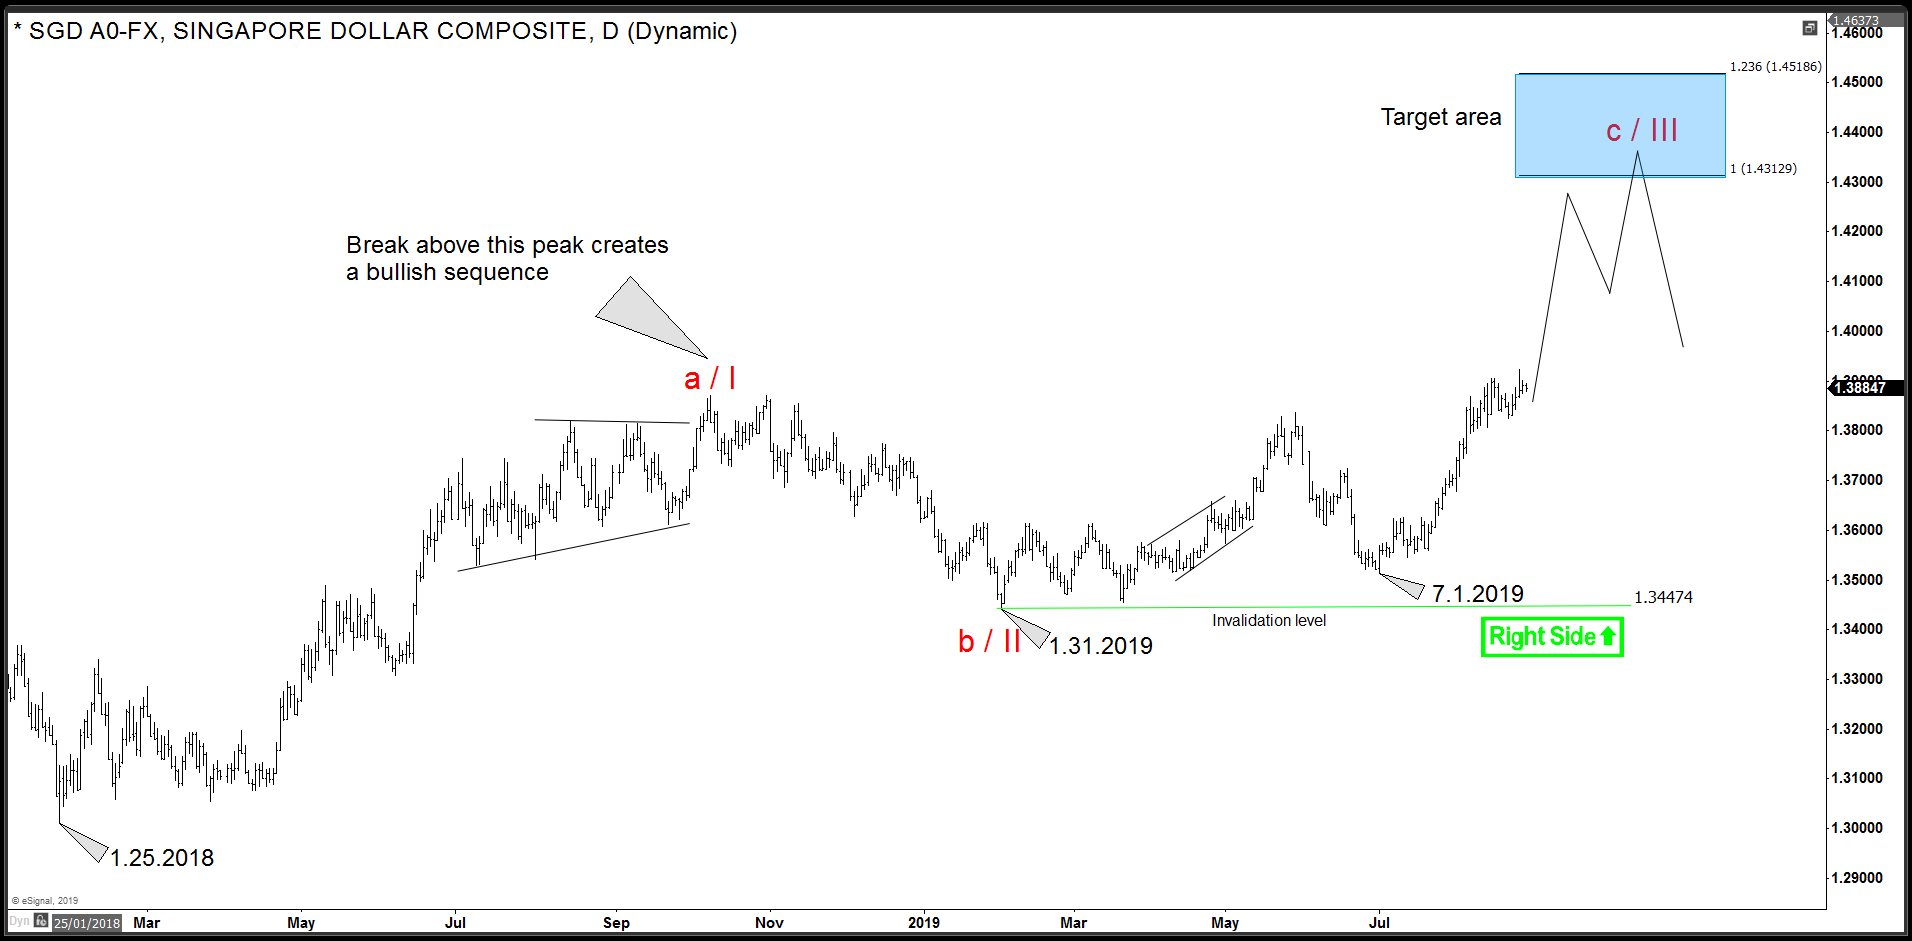
USDSGD Bullish Sequence Since 1.25.2018 Low
USDSGD recently broke above 10.9.2018 peak which is labelled a/I in the chart below and break of this peak creates an incomplete bullish sequence from 1.25.2018 low against 1.31.2019 low. As dips hold above 7.1.2019 low and more importantly above 1.31.2019 low, expect the pair to continue higher and eventually reach target area between 1.4312 – 1.4518 which is highlighted with a blue box on the chart below.
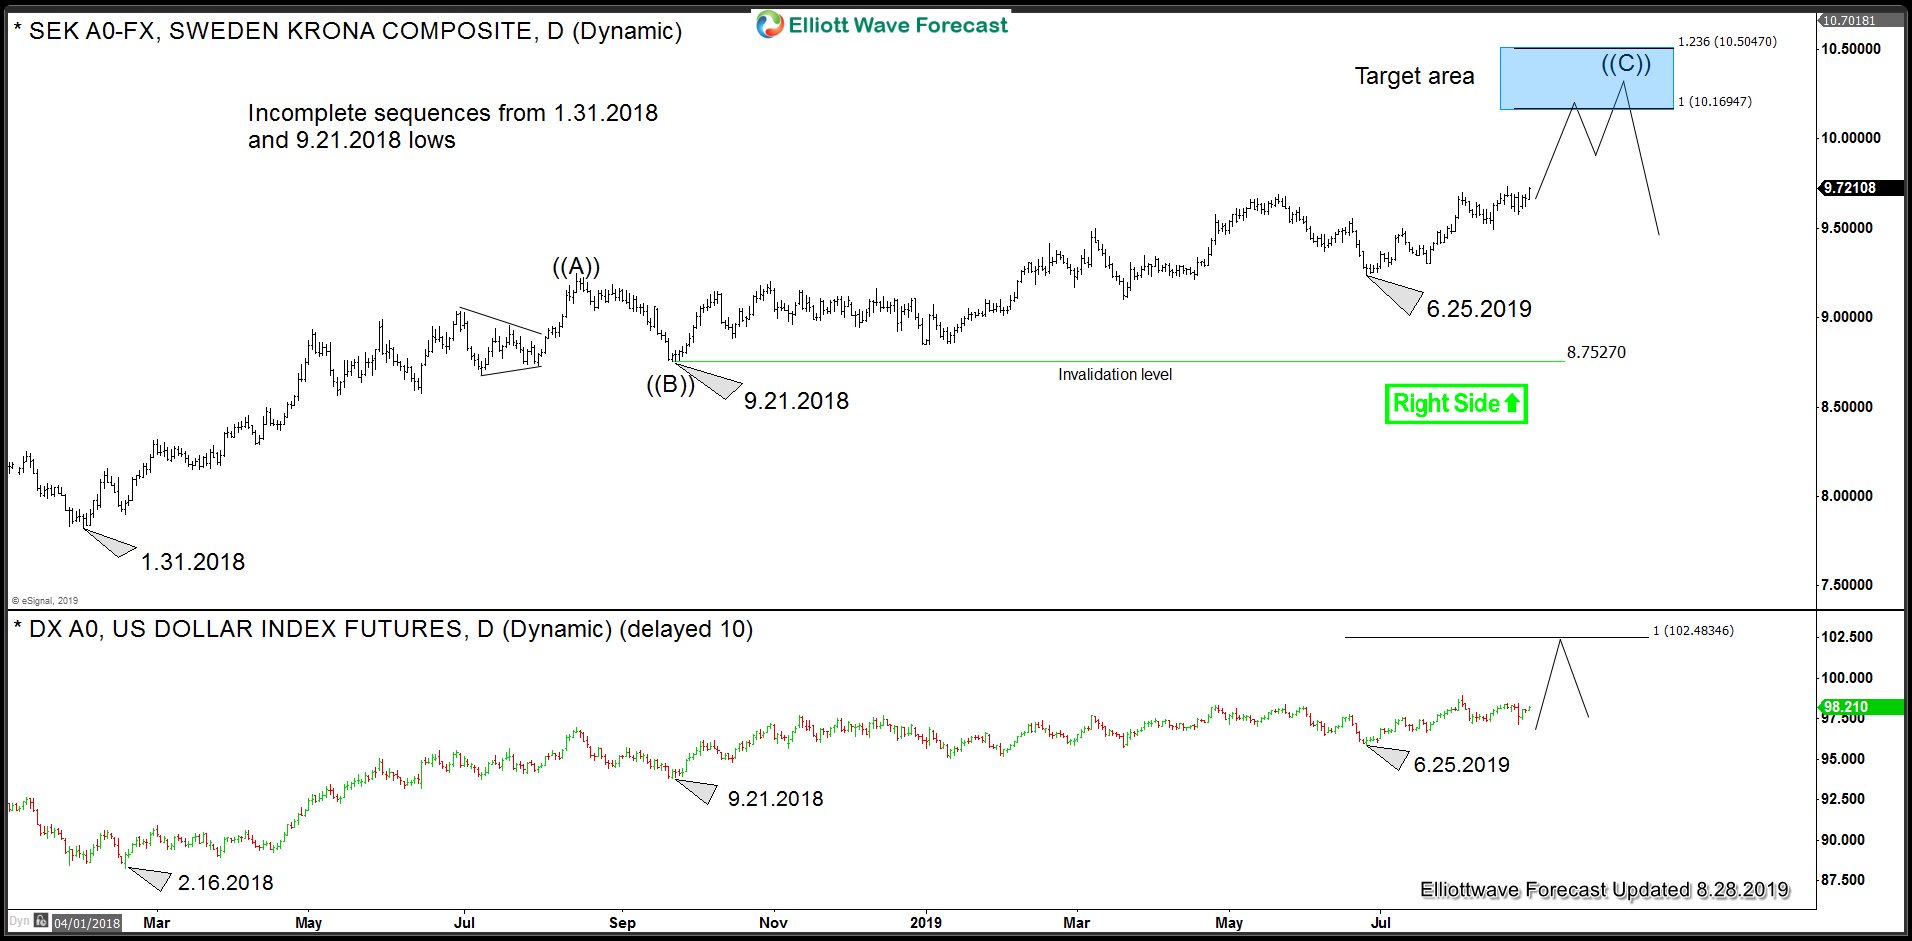
USDSEK overlay with US Dollar Index
Chart below shows US Dollar Index overlaid with USDSEK and we can see USDX low in 2018 is similar 1.31.2018 low in USDSEK and 9.21.2018 low is the same in both USDSEK and USDX. Therefore, we can conclude that USDX would remain supported until USDSEK doesn’t reach 10.16 – 10.50 area and USDSGD doesn’t reach 1.43 – 1.45 area. Our strategy remains to keep looking for buying opportunities in the dips in 3, 7 or 11 swings and we don’t like the selling.