
In this technical blog, we are going to take a look at the past performance of 1 hour Elliott Wave Charts of Nifty index from India, which we presented to members at elliottwave-forecast.com. In which, the rally from 1/29/2019 low showed higher high sequence favored more upside to take place. Also, the right side tag pointed higher against 11109.98 low looking for more upside. Therefore, we advised members not to sell the index & buying the blue boxes remained the preferred path looking for 3 wave reaction higher at least. We will explain the structure & forecast below:
Nifty 4 Hour Elliott Wave Chart From 6/16/2019 Update
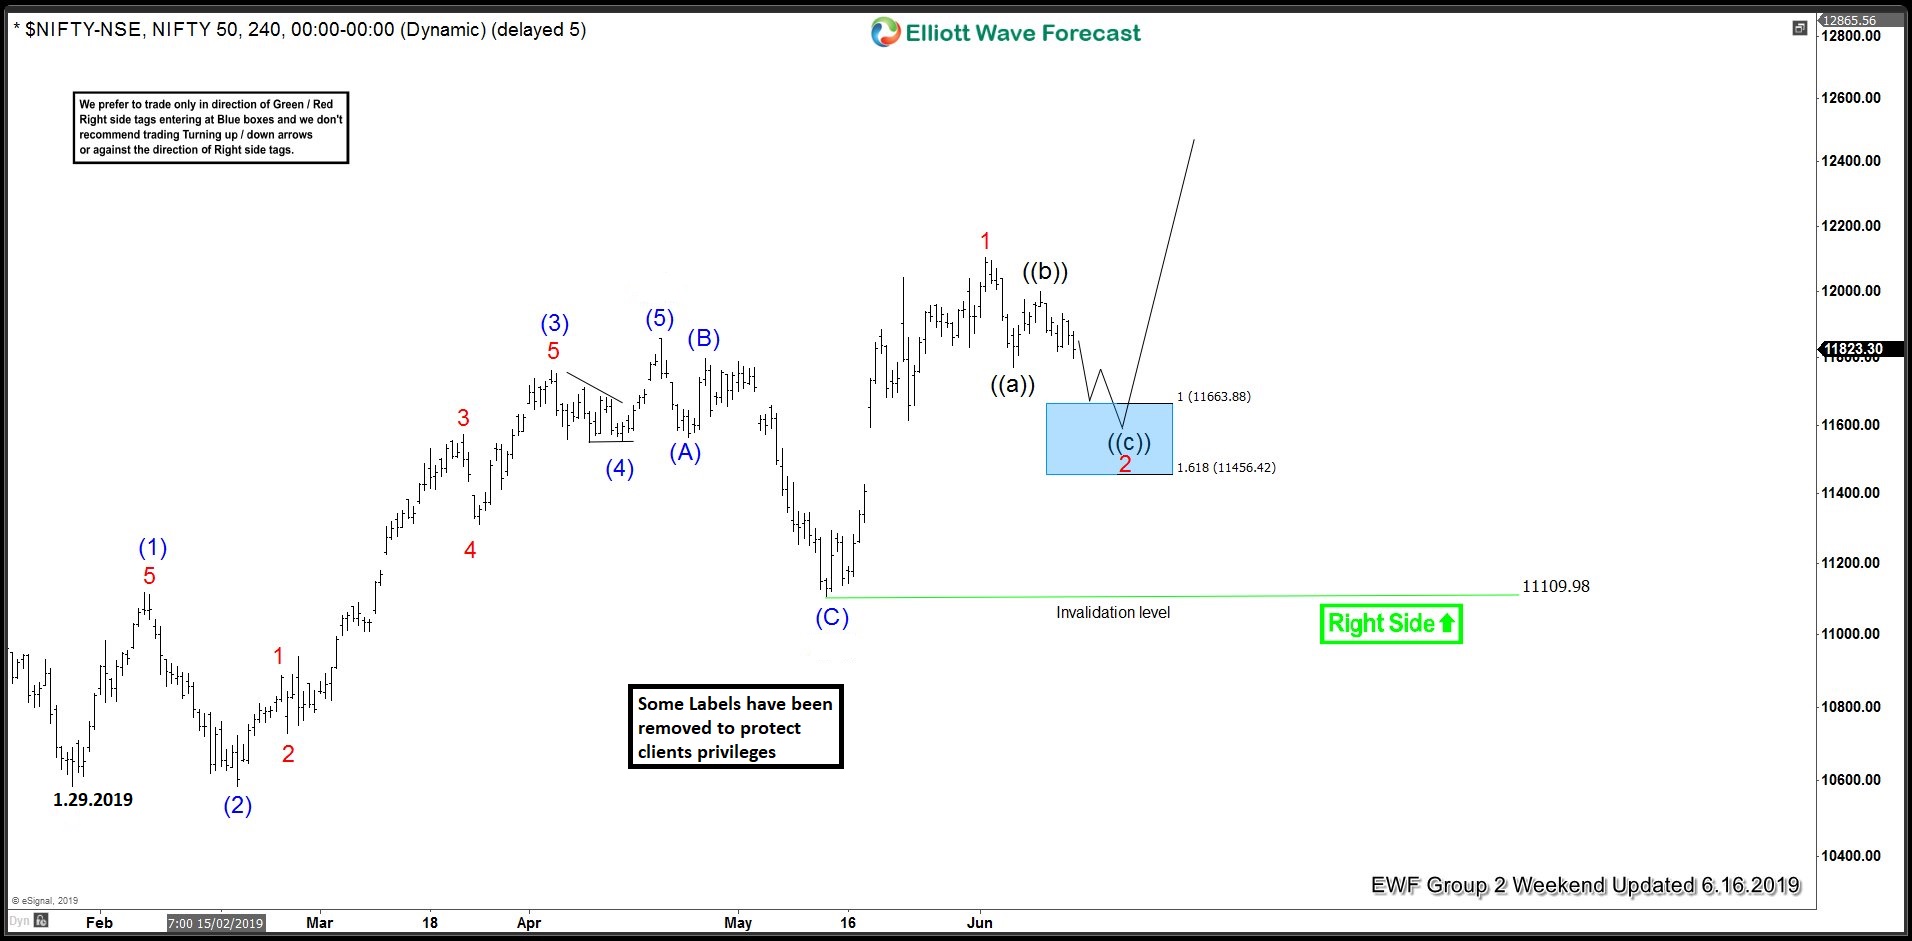
Nifty 4 hour Elliott Wave Chart from 6/16/2019 weekend update, in which the rally from 1/29/2019 low showed higher high sequence. Also, it’s important to note here that the right side is pointing higher calling for more upside as far as dips remain above 11109.98 low. Up from there, the rally to 12103.05 high ended wave 1. Down from there, the index was expected to make a 3 wave pullback as zigzag structure within wave 2 before more upside can be seen. Therefore, our strategy remained buying the wave 2 Elliott wave dip towards the blue box area looking for more upside.
Nifty 1 Hour Elliott Wave Chart From 6/19/2019 Update
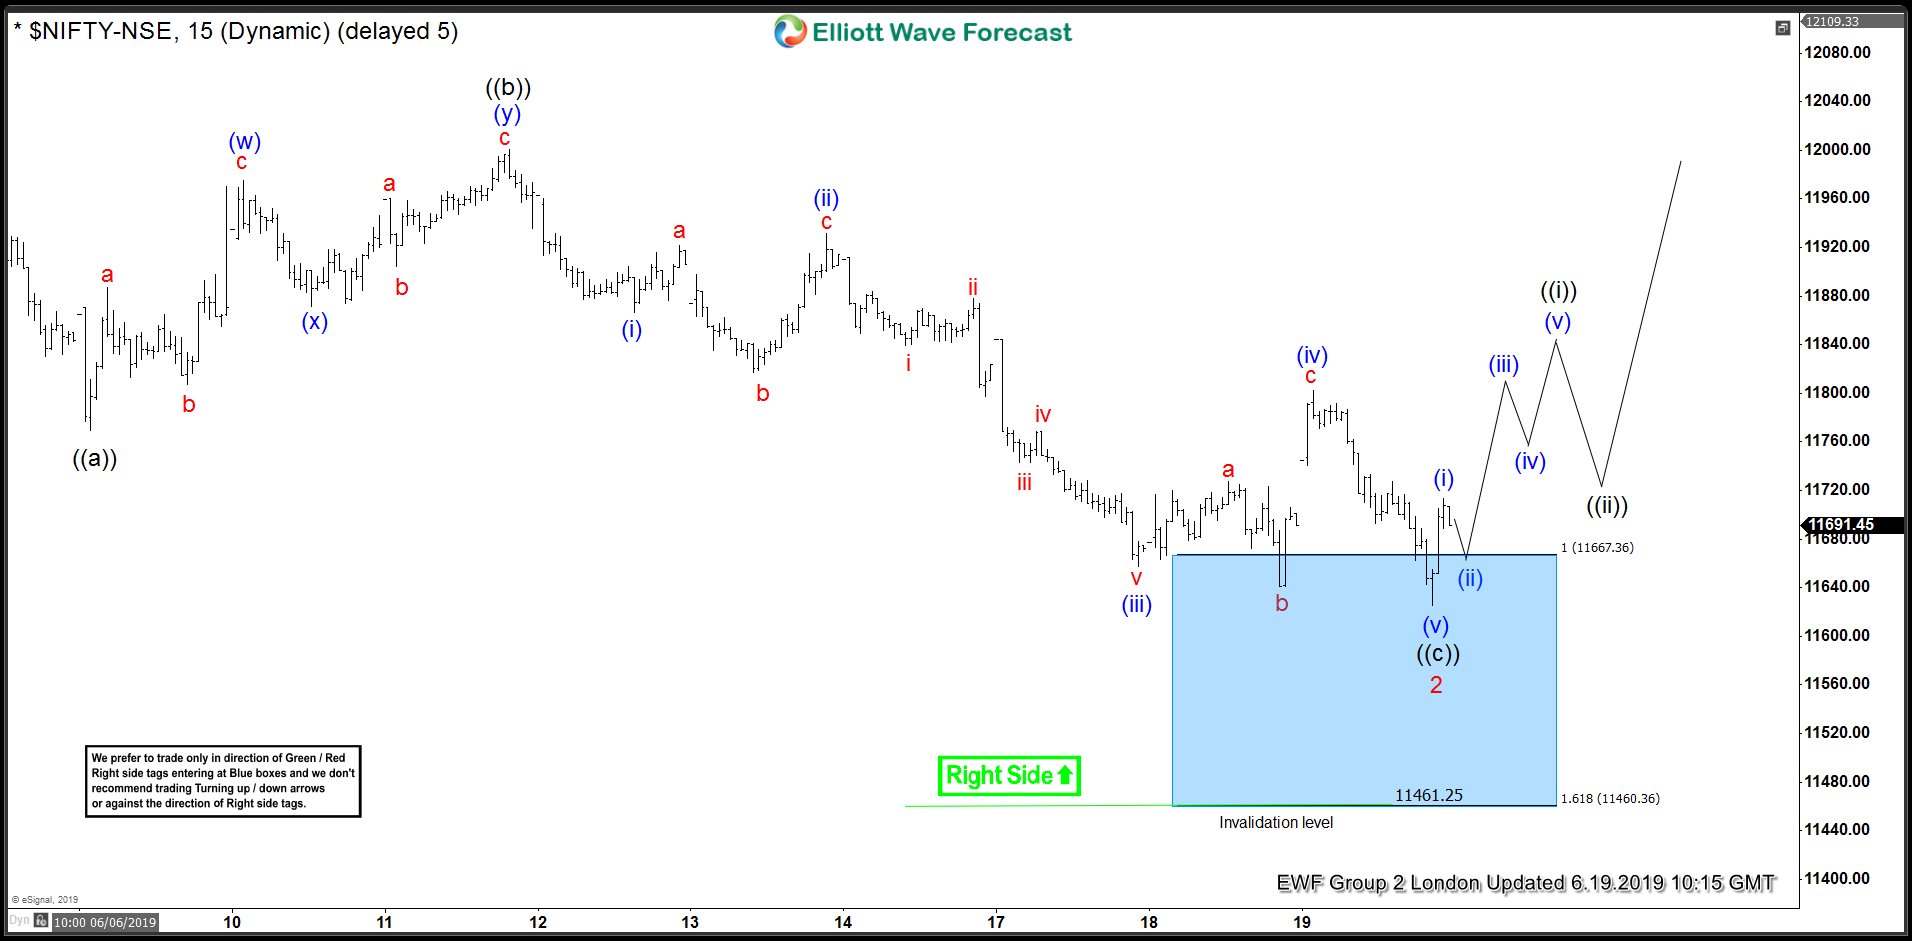
Here’s Nifty 1 hour Elliott Wave Chart from 6/19/2019 London update, in which the index managed to reach the blue box area at 11667.36-11460.36 100%-161.8% Fibonacci extension area of ((a))-((b)) as expected. And provided buying opportunity to our members in that area looking for next extension higher or for 3 wave bounce at least.
Nifty 1 Hour Elliott Wave Chart From 6/20/2019 Update
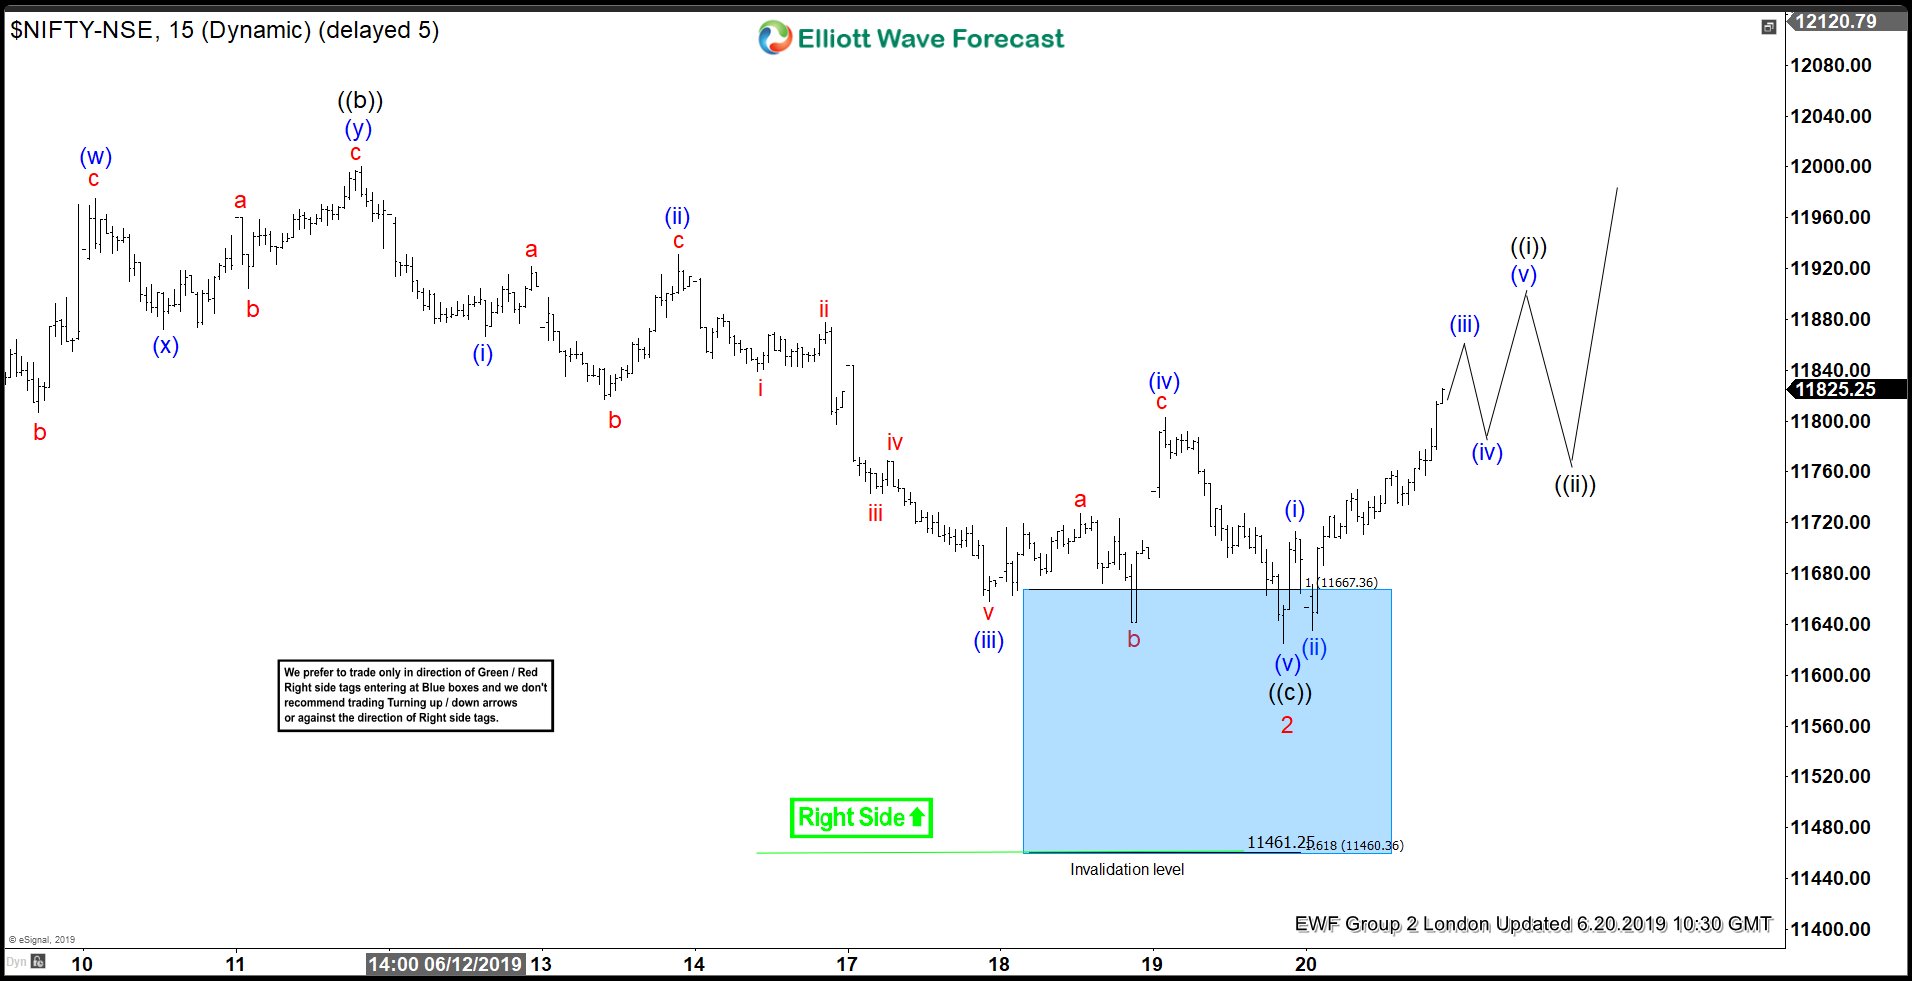
Here’s 1 hour Elliott Wave Chart of Nifty from 6/20/2019 London update, in which the index provided the buying opportunity ta blue box area & bounced higher as expected. Allowing members to create a risk-free position shortly after taking the trade at the blue box area. However, a break above 12103.05 high from 6/03/2019 peak remains to be seen for final confirmation of next extension higher & to avoid double correction lower in wave 2 pullback.