Hello fellow traders. In this technical blog we’re going to take a quick look at the charts of GOLD published in members area of the website. GOLD has had incomplete sequences in the cycle from the February 2oth peak (1347.43) . Consequently , we advised clients to avoid buying GOLD and keep on selling the rallies in 3,7,11 swings when given the opportunity.
In the charts below, we’re going to explain the Elliott Wave Structure and Trading Strategy.
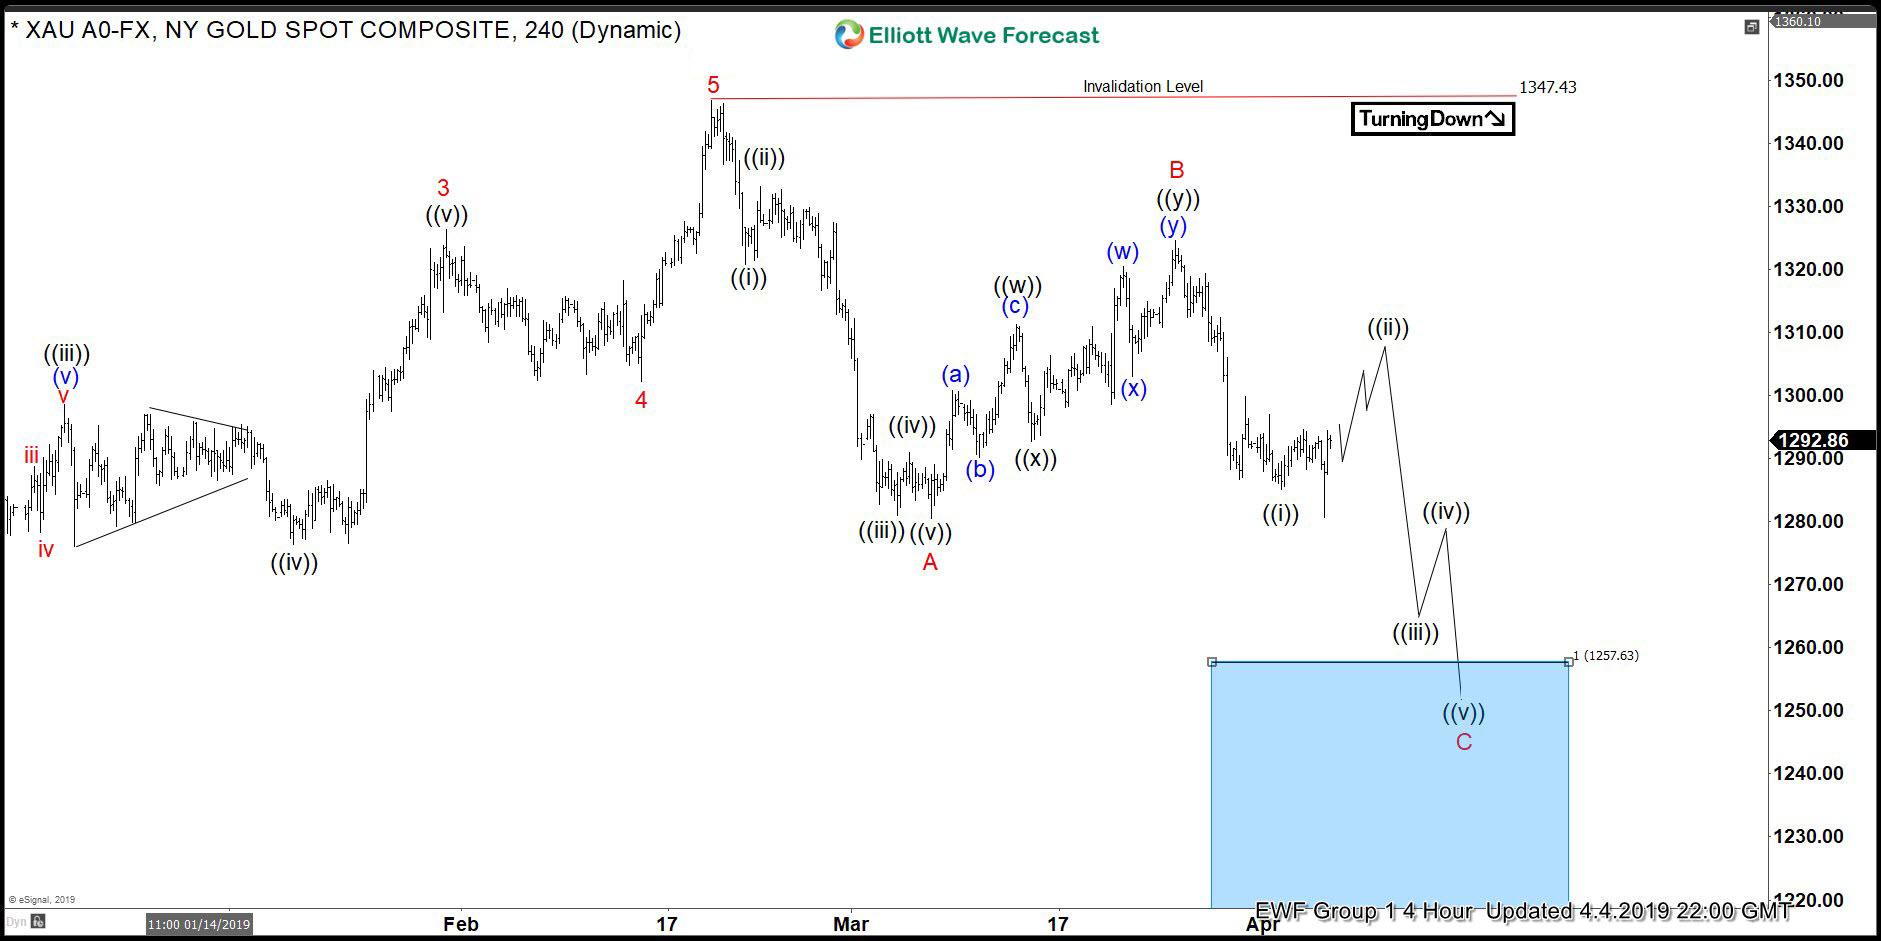
GOLD Elliott Wave 4 Hour Chart 4.4.2019
Break of 03/07 low made February cycle incomplete to the downside, suggesting the Commodity is bearish against the 03/25peak- B red. As far as the pivot at B red high holds, we should be ideally doing wav C red . The commodity is targeting 1257.63 area- Blue Box.
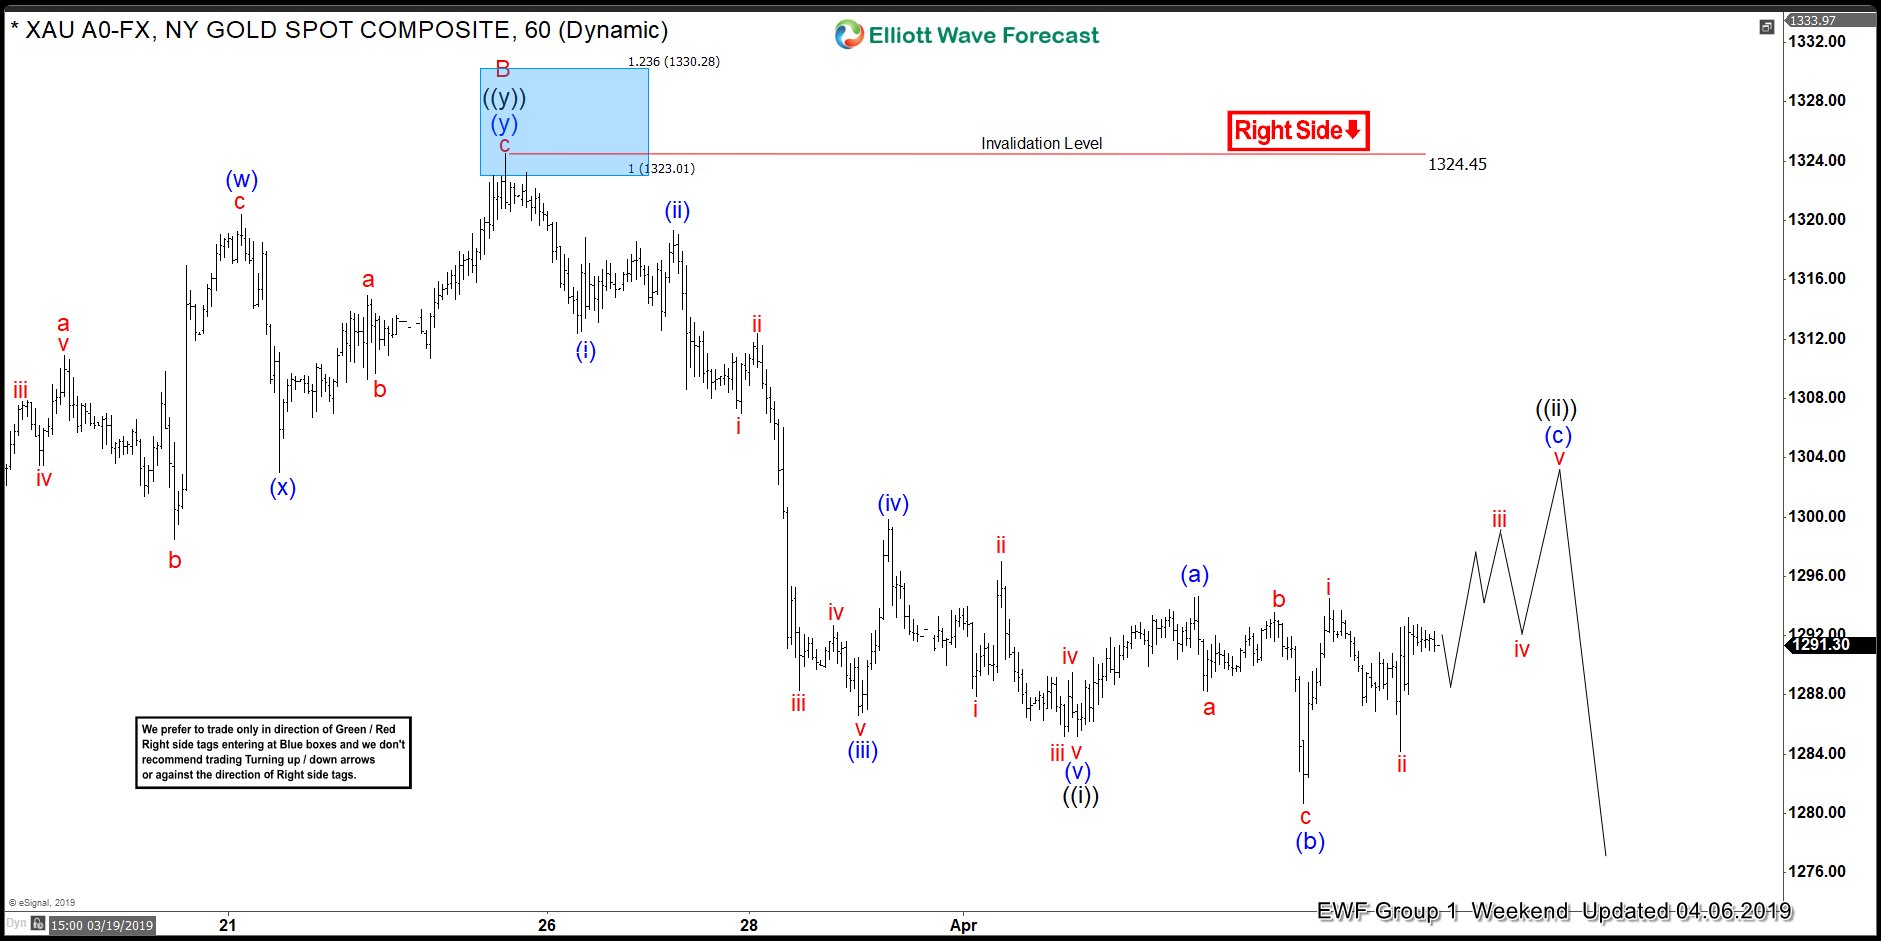
GOLD Elliott Wave 1 Hour Chart 4.06.2019
As we can see at the charts below, GOLD is bearish against the 1324.45 peak . Proposed short term bounce ((i)) seems to be unfolding as a Elliott Wave Flat pattern when we can be in (c) of ((ii)) . Wave (c) should make 5 waves from the low to complete proposed pattern. We don’t recommend buying GOLD in proposed bounce and although the right side is bearish, we remind our members that Elliott Wave Flats can be tricky to trade and to be more careful at this stage. Anyway as far as pivot at 1324.45 peak holds, we favor short side in the commodity.
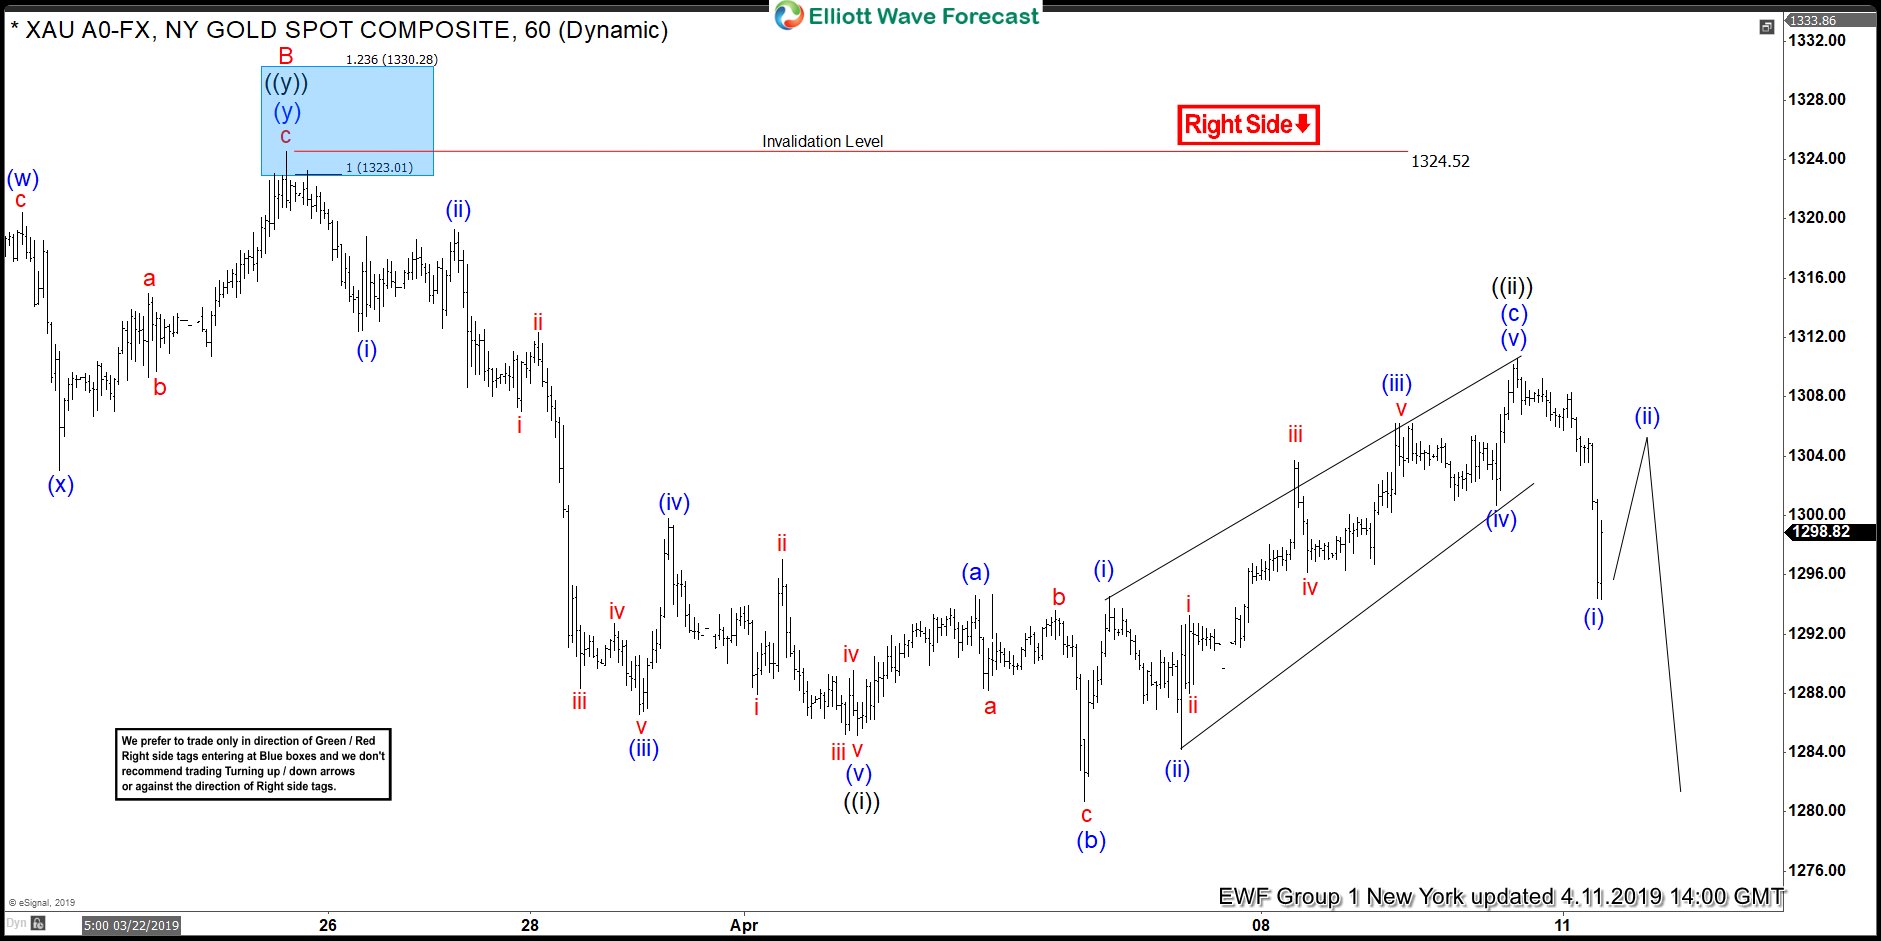
GOLD Elliott Wave 1 Hour Chart 4.11.2019
We got expected bounce and 5 waves from the low. Short term rally in wave (c) looks like Elliott Wave Ending Diagonal. Current view suggests that recovery is completed as wave Irregular Flat ((ii)) black. The chart is calling for further weakness within February cycle.
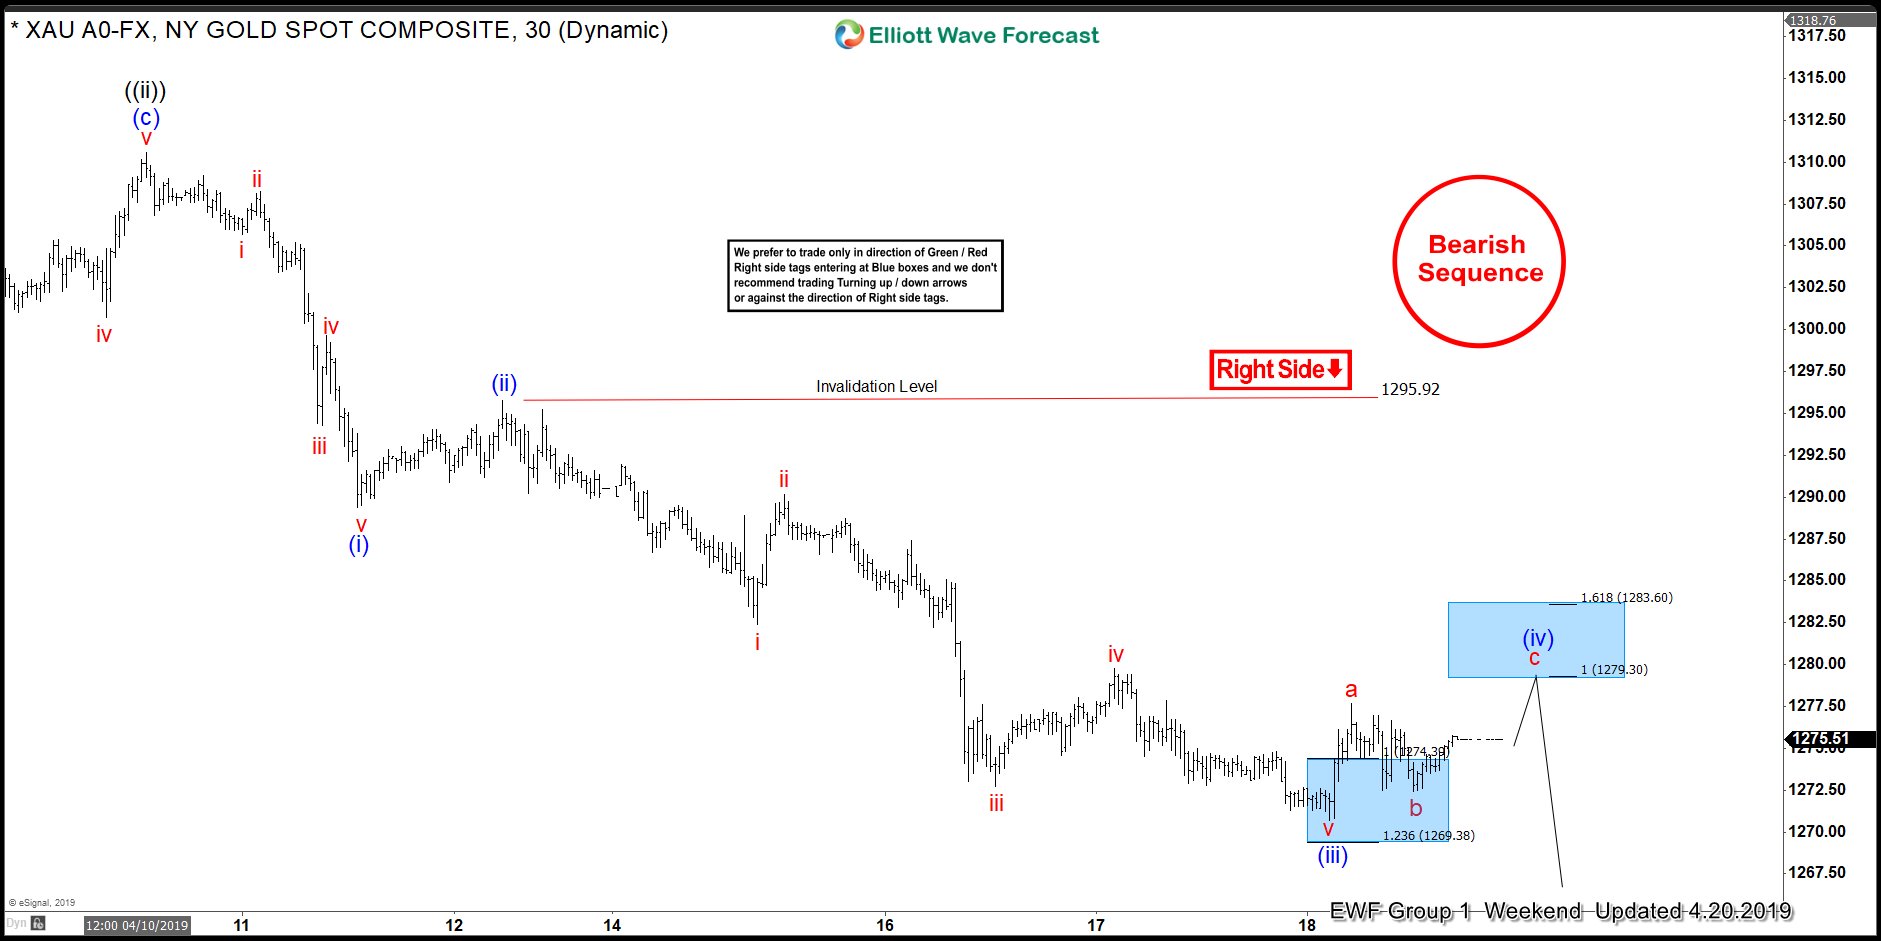
GOLD Elliott Wave 1 Hour Chart 4.20.2019
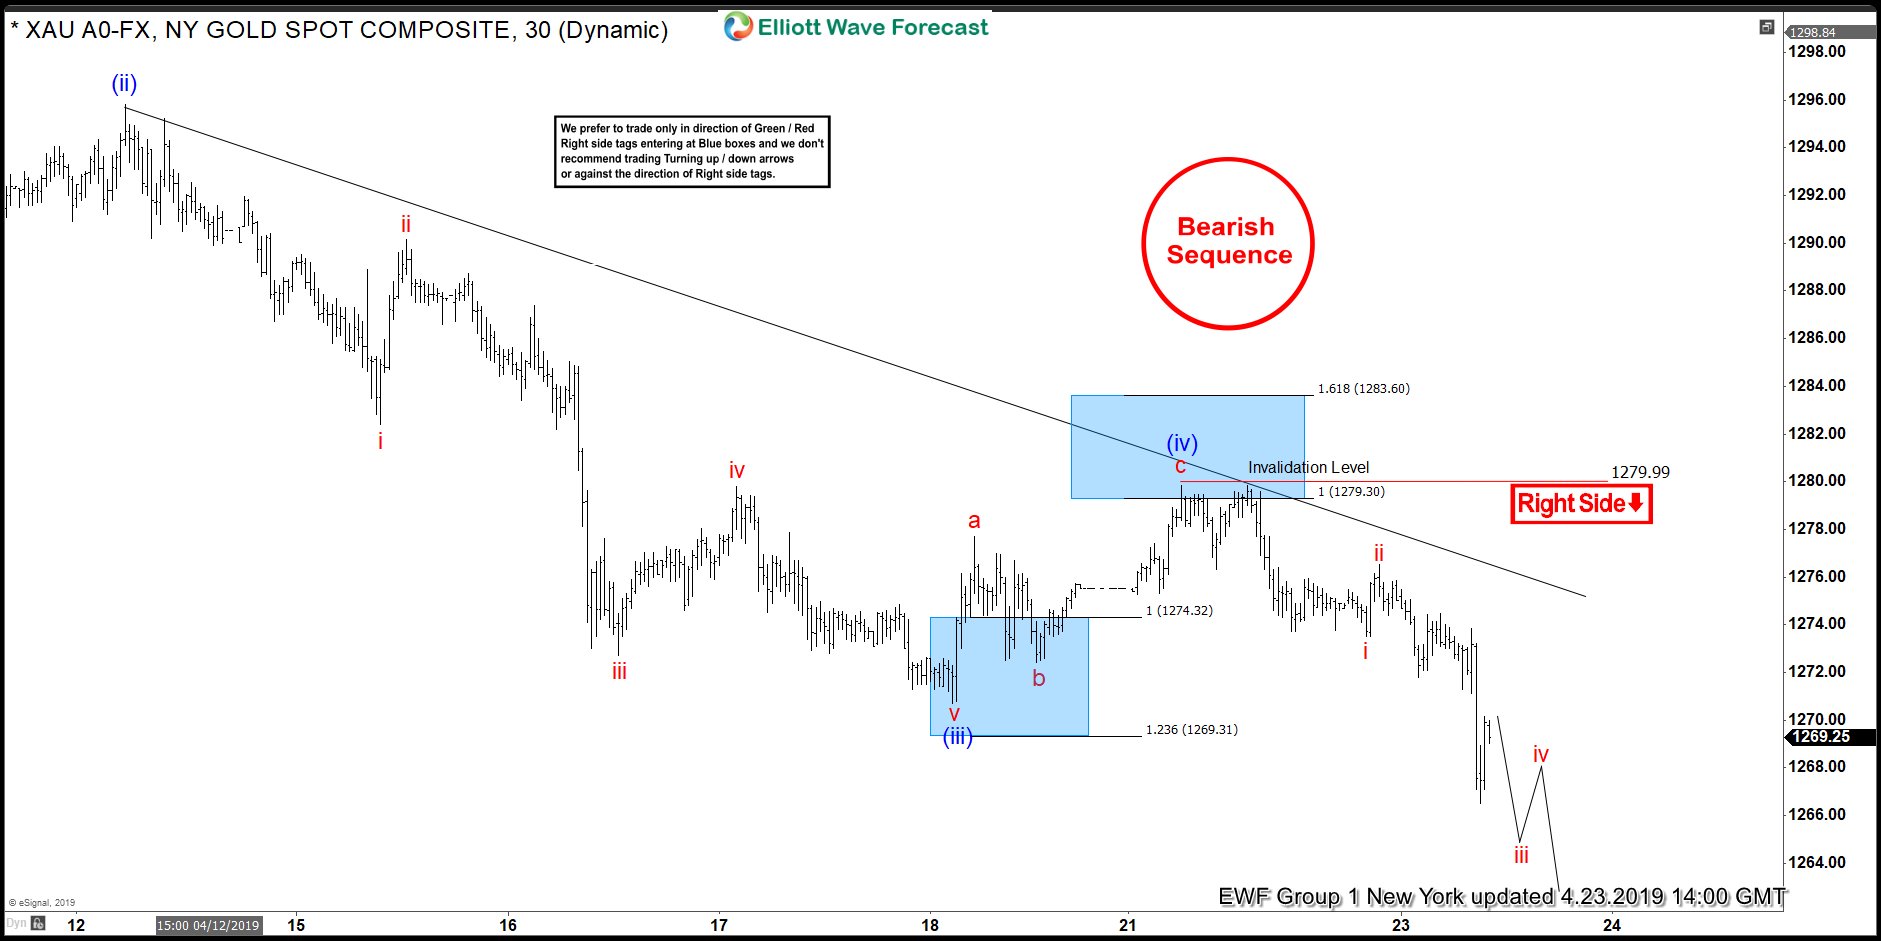
Eventually we got another short term low in Commodity which has made cycle from the 1324.52 (03/25) peak incomplete as well, confirming further weakness. Current view suggests GOLD is doing short term recovery against the 1295.92 peak. We can get another leg up toward short term blue box area :1279.3-1283.6 ( sell zone) . At that area we like to be sellers for further delcine ideally or 3 wave pull back alternatively. Stop Loss of the trade is a break above 1.618 Fibonacci extension (12836.3). As our members know Blue Boxes are no enemy areas , giving us 85% chance to get a reaction.
GOLD Elliott Wave 1 Hour Chart 4.20.2019
GOLD has made proposed leg up and found sellers right at the blue box : 1279.3-1283.6 . Recovery ended at 1279.99 high and we have already got new short term low, confirming next leg down is in progress. As a result members who took short trades are now enjoying profits with risk free positions.
Keep in mind that market is dynamic and presented view could have changed in the mean time. Best instruments to trade are those having incomplete bullish or bearish swings sequences. We put them in Sequence Report and best among them are shown in the Live Trading Room. You can check most recent charts in the membership area of the site.