In today’s blog, we will have a look at the latest price action of the Caterpillar.
Caterpillar is an American company which has its headquarter in Deerfield Illinois. Caterpillar is one of the largest construction equipment manufacturer in the world. It is listed in the Dow Jones Industrial Average.
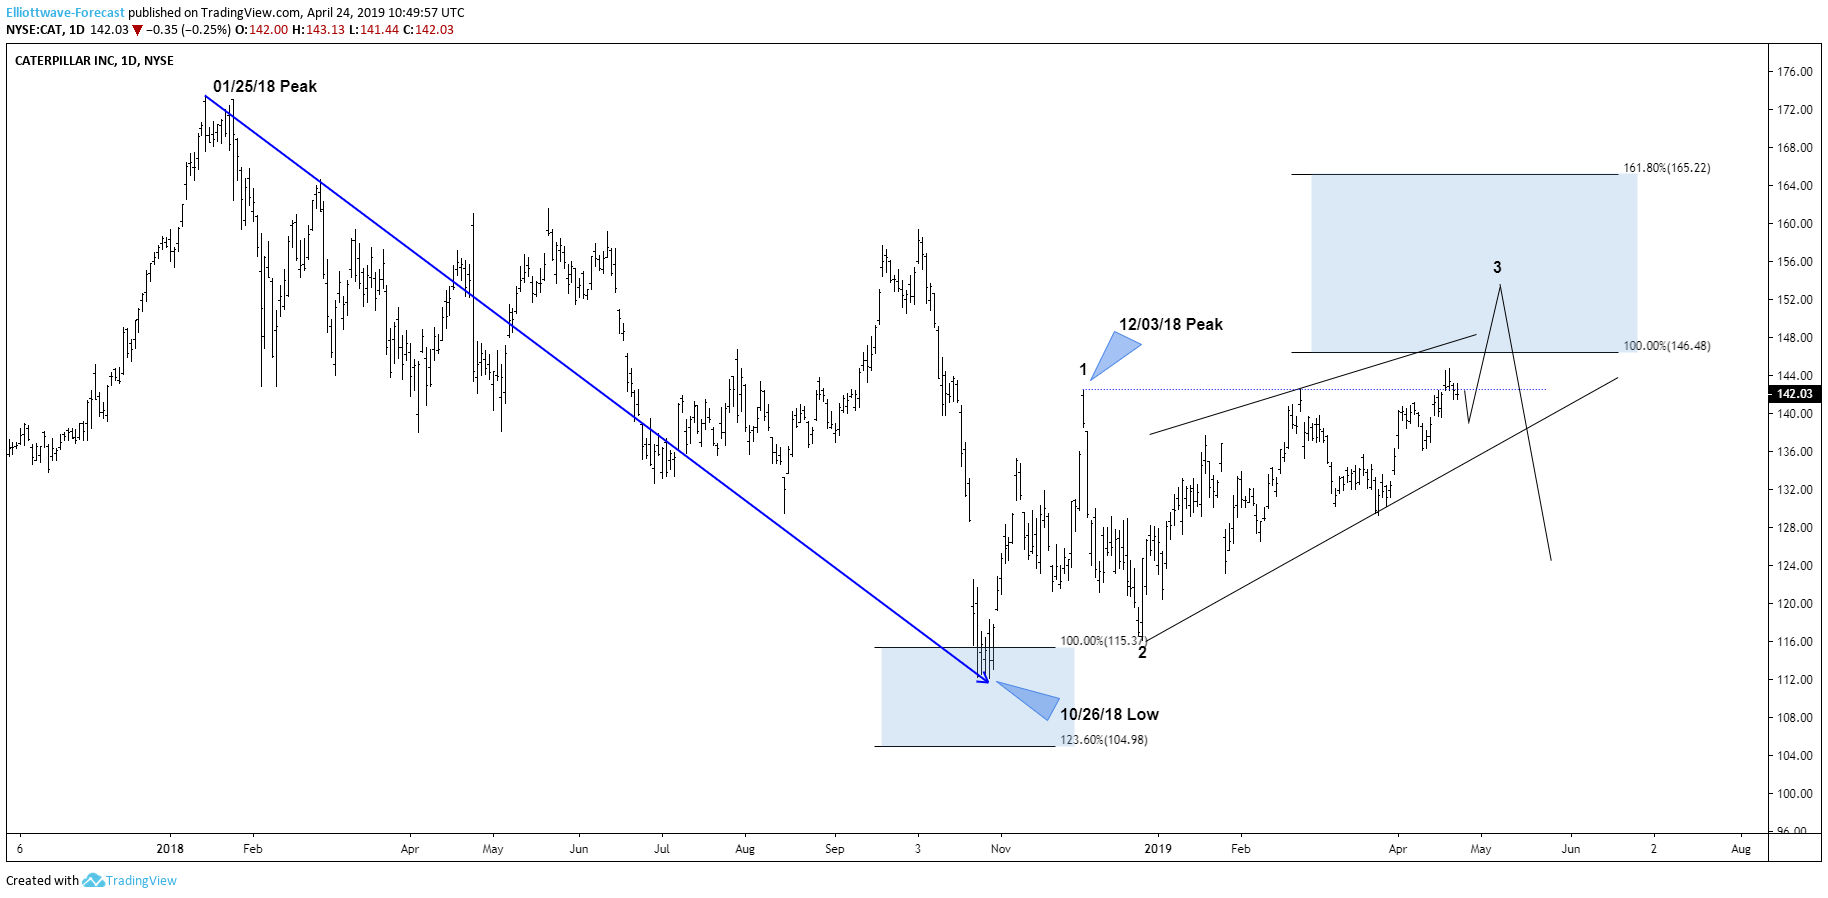
The company released yesterday its first-quarter earnings. The revenue came out at $13.47 billion, which was higher than the expectations of $13.27 billion. Adjusted earnings per share: $2.94, beating expectations of $2.83. Even tho the earnings came out pretty strong. The stock dipped in the opening. Below you can see the daily chart of Caterpillar before the opening. It was expected to dip before more upside should be seen.
The stock ended the cycle from 01/25/18 peak at the 10/25/18 low. Above from there, it managed to break above 12/03/18 peak making it an incomplete sequence from that low, indicating more upside into the equal legs (blue box) towards 146.48+ areas. Where a bigger reaction lower should be seen. (Swing counts do not reflect Elliott Wave counts!)
Caterpillar 04.24.2019 Daily Sequence Analysis
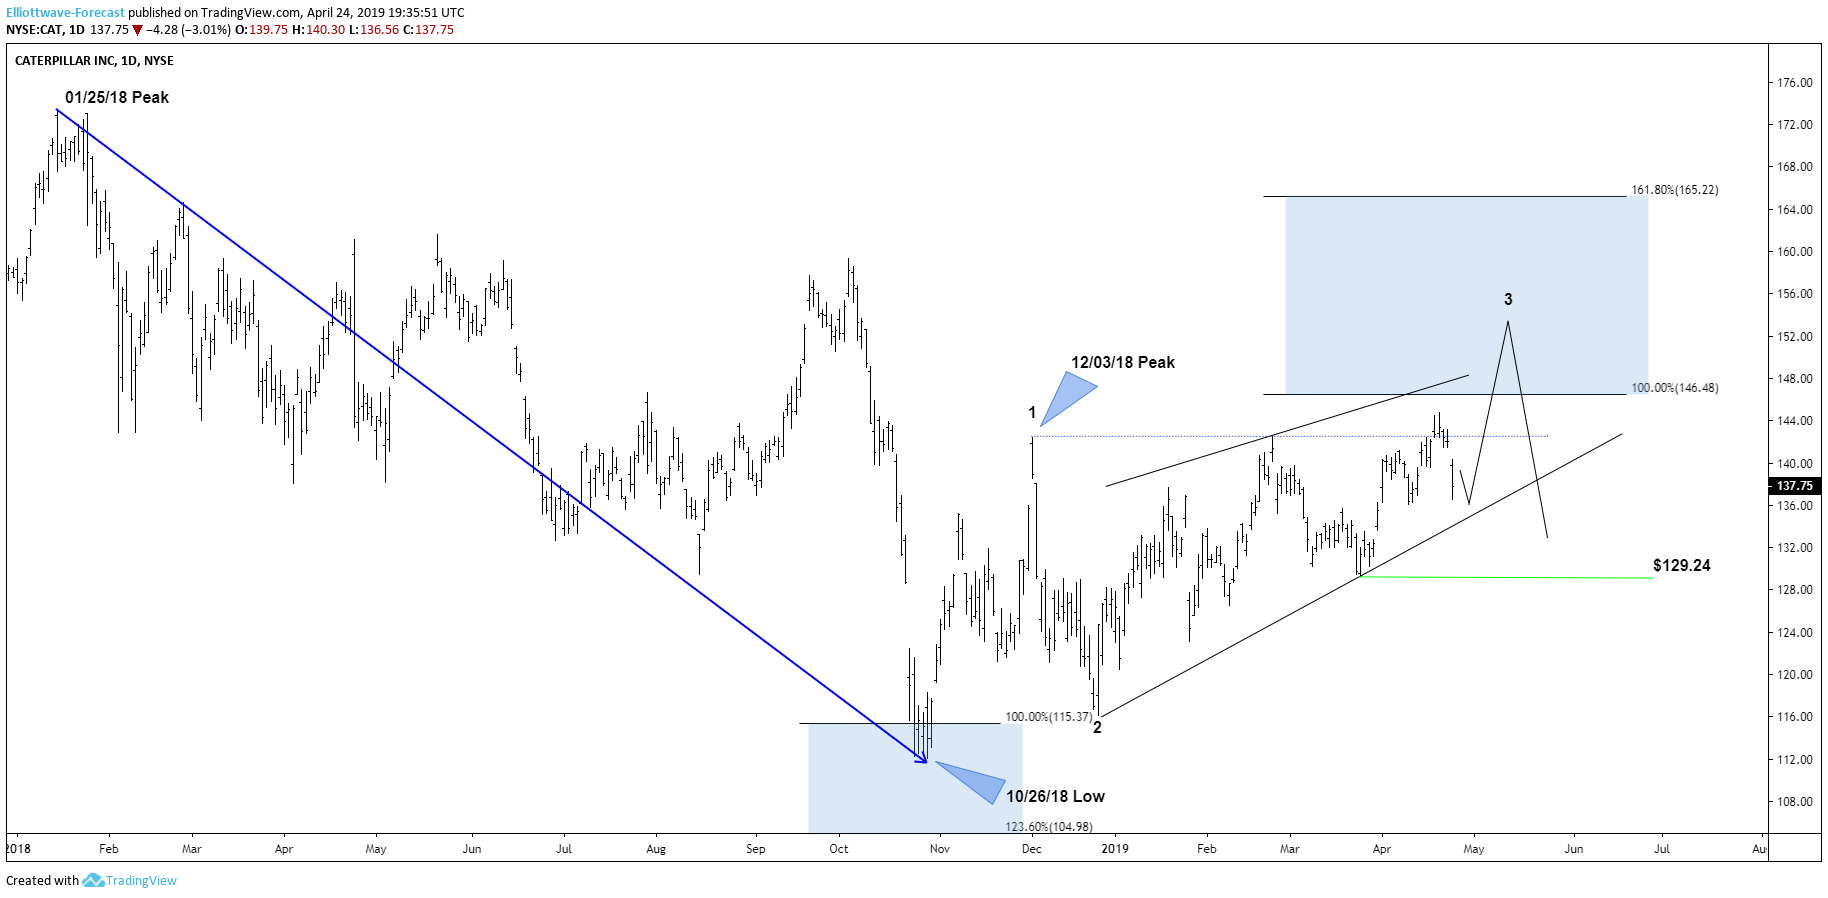
In the last chart below you can see the price action after its earnings release. And like expected it pulled back. As long as it manages to stay above 129.24 low it is still capable of trading higher into the equal legs extreme area (blue box) before a bigger reaction in Caterpillar should take place. For now, any pullback against 129.24 low should find buyers again in the sequences of 3-7 or 11 swings, targeting the equal legs area ($146.48-165.22).
Caterpillar 04.24.2019 after the earnings release
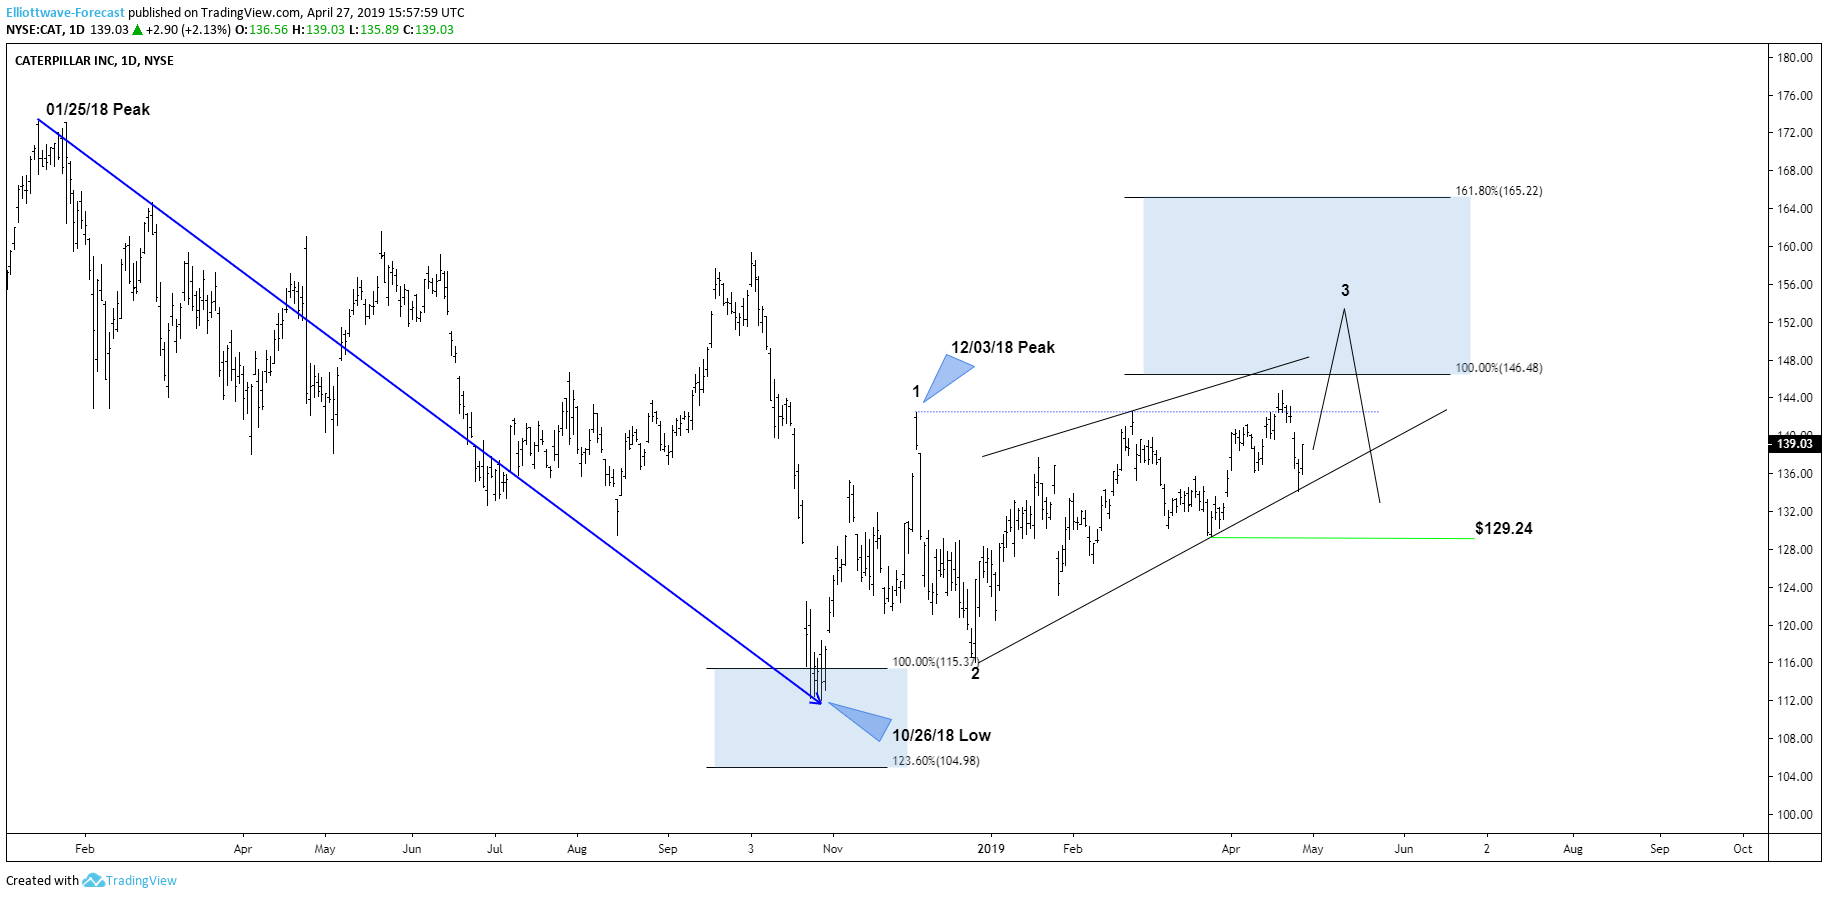
In the latest update below you can see that Caterpillar has been holding the trendline like expected. Ideally, it continues now higher into the blue box area where a reaction lower should take place.
UPDATE: Caterpillar 04.27.2019