
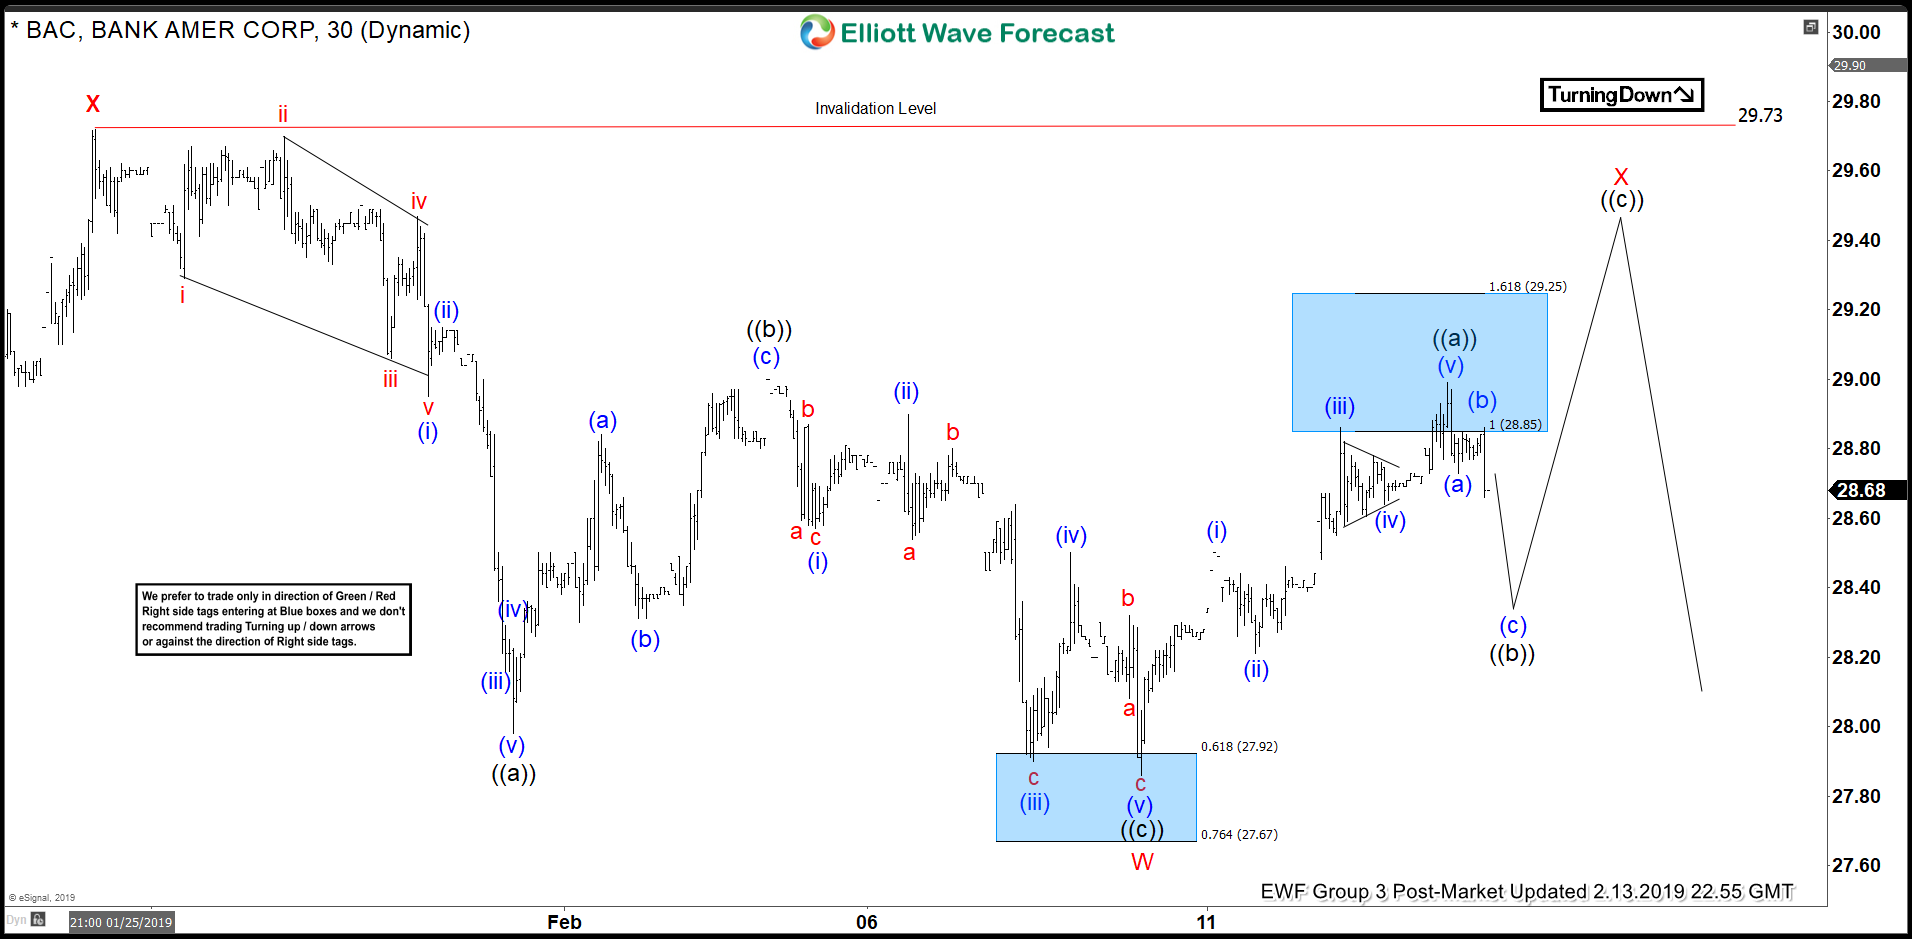
Today, I want to share with you some Elliott Wave charts of the Bank of America stock ( BAC ), which we presented to our members at Elliott Wave Forecast. You see the 1-hour updated chart presented to our clients on the 02/13/19 below.
BAC ended the cycle from 01/25/19 peak at the low of 02/08/19 in red wave W. The internal structure of red wave W unfolded as an Elliott Wave ZigZag structure (5-3-5). The decline ended black wave ((a)) at 27.99 low. The stock then bounced in black wave ((b)) and ended at 29.02 high. Below from there it reached 27.92-27.67 areas which was the 0.618-0.764 extension of black wave ((a))-((b)). The stock truncated at that area and therefore, ended the cycle from 01/25/19 high in red wave W at 27.85.
Above from there, we expected a bounce to occur in the sequence of 3-7 or 11 swings to correct the cycle from 01/25/19 peak. In the first chart below you can see that BAC reached the first blue box area at 28.85-29.25. This is the area where we expect a reaction lower to take place. However, due to the fact that other stocks and some indices indicate more strength in short-term, BAC might continue the bounce in red wave X. Thus, this bounce can be just the first leg in black wave ((a)) which has ended at around 29 peak. Below from there a pullback in black wave ((b)) is in progress, after which black wave ((c)) rally should take place. This push higher will end the higher degree bounce in wave X.
BAC 02.13.2019 1 Hour Chart Elliott Wave Analysis
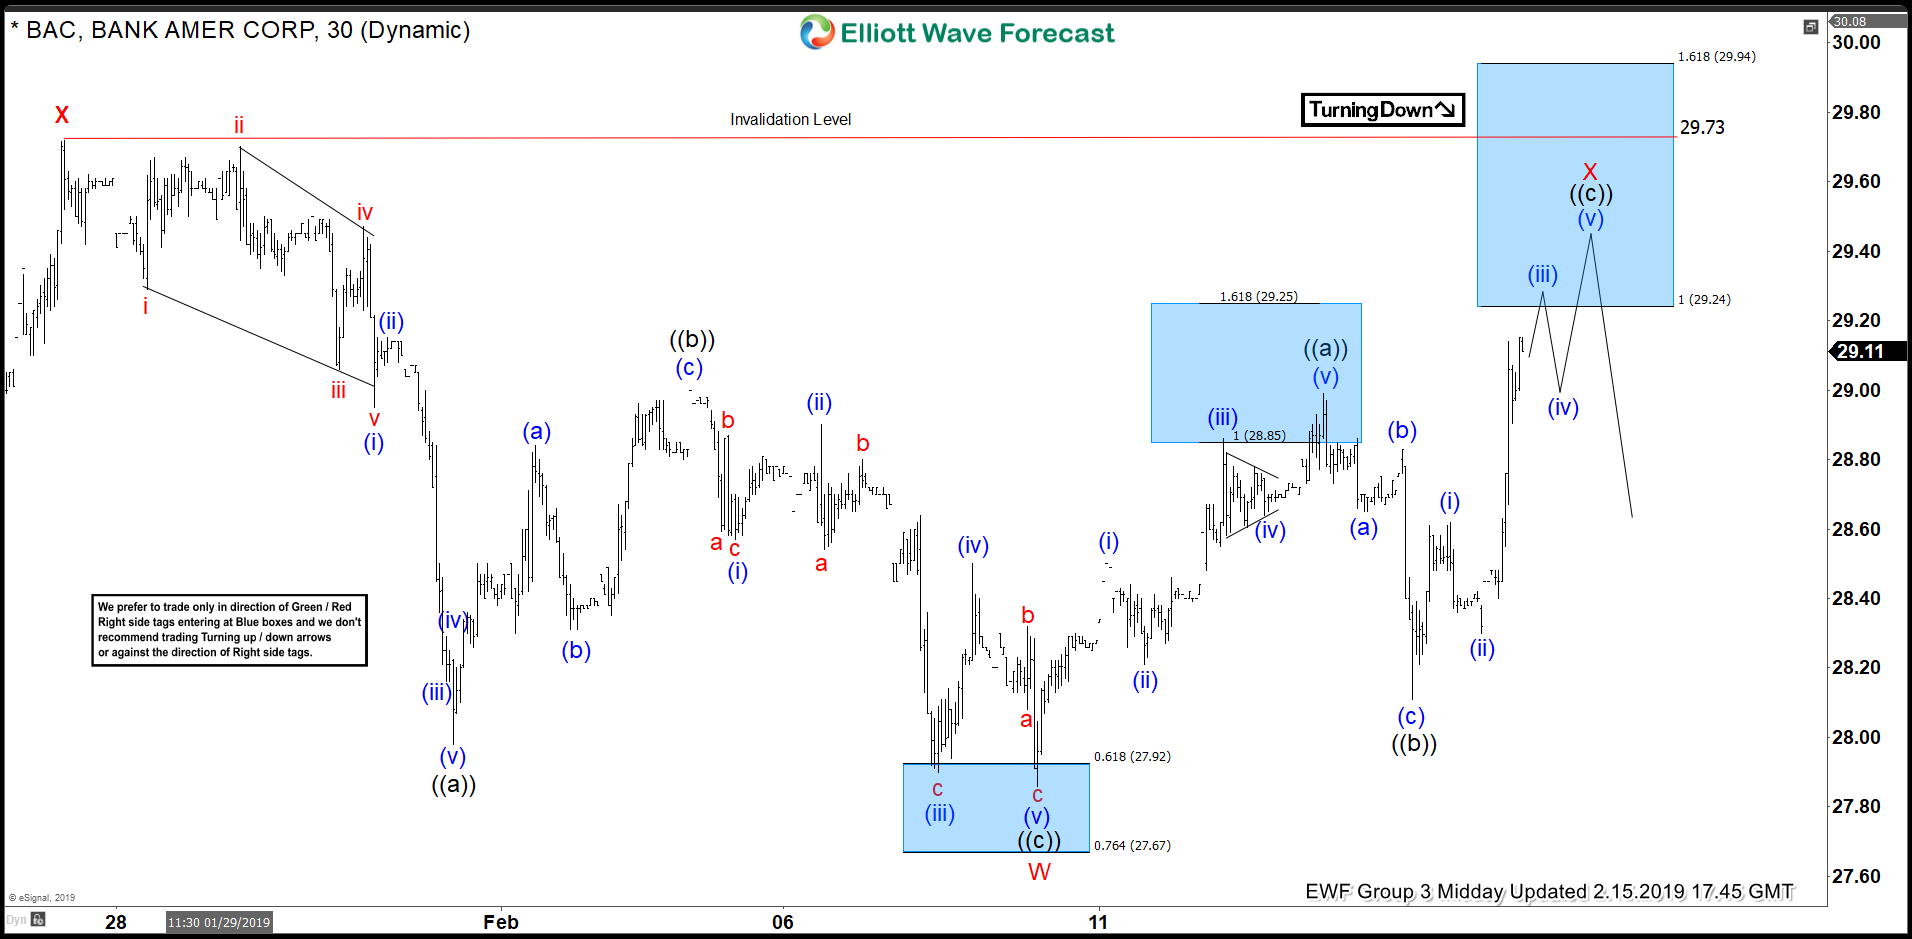
In the Elliott Wave chart update below. You can see that BAC reacted nicely lower from the first blue box area (28.85-29.25). Then it ended black wave ((b)) at 28.10 and rallied higher in wave ((c)) into the next blue box which came at 29.24-29.94. The box should see a reaction lower. In conclusion, our forecast is very accurate. Please keep in mind that the 1-hour chart which I presented have changed as the 1 hour chart is moving very dynamically.
The purpose of this blog is just to illustrate how accurate our blue boxes are. Furthermore, it shows you that the market respects our blue box. Our members can use the blue box and right side stamp to buy/sell correction in 3-7 or 11 swings.
BAC 02.15.2019 1 Hour Chart Elliott Wave Analysis
I hope you like this blog. We have developed a very good trading strategy that defines entry, stop loss and take profit levels with high accuracy. Our strategy allows members to get a high probability of getting a risk-free position shortly after entering in the trade to protect possible losses.