DAX has broken above February 6, 2019 high (11371.74) and shows a bullish sequence from December 28, 2018 low (10279.20). On the chart below, we put a bullish sequence stamp and right side higher to indicate the direction that we prefer to trade. The correction to 10867.9 low ended wave ((X)) as an Expanded Flat Elliott Wave. A Flat is a 3-3-5 structure with ABC label. The decline to 11051.11 ended wave (A), wave (B) bounce ended at 11371.74. Wave (C) of ((X)) ended at 10863.56.
After ending wave ((X)) at 10863.56, the Index has rallied and broken above the previous wave (B) high at 11371.74. This suggests that the next leg higher has likely started. The rally from 10867.9 low is unfolding as an Impulse Elliott Wave structure. Up from 10867.9, wave 1 ended at 11217.3, wave 2 ended at 11018.95, wave 3 ended at 11371.44, and wave 4 ended at 11244.52. Expect DAX to end the 5 waves move with 1 more leg higher at the blue box area of 11400.25 – 11479.66. Afterwards, the Index should pullback in wave (B) in the sequence of 3, 7, or 11 swing to correct the cycle from February 9, 2019 low. As far as the pullback stays above 10867.9, expect the Index to resume higher again. We do not like selling the proposed pullback.
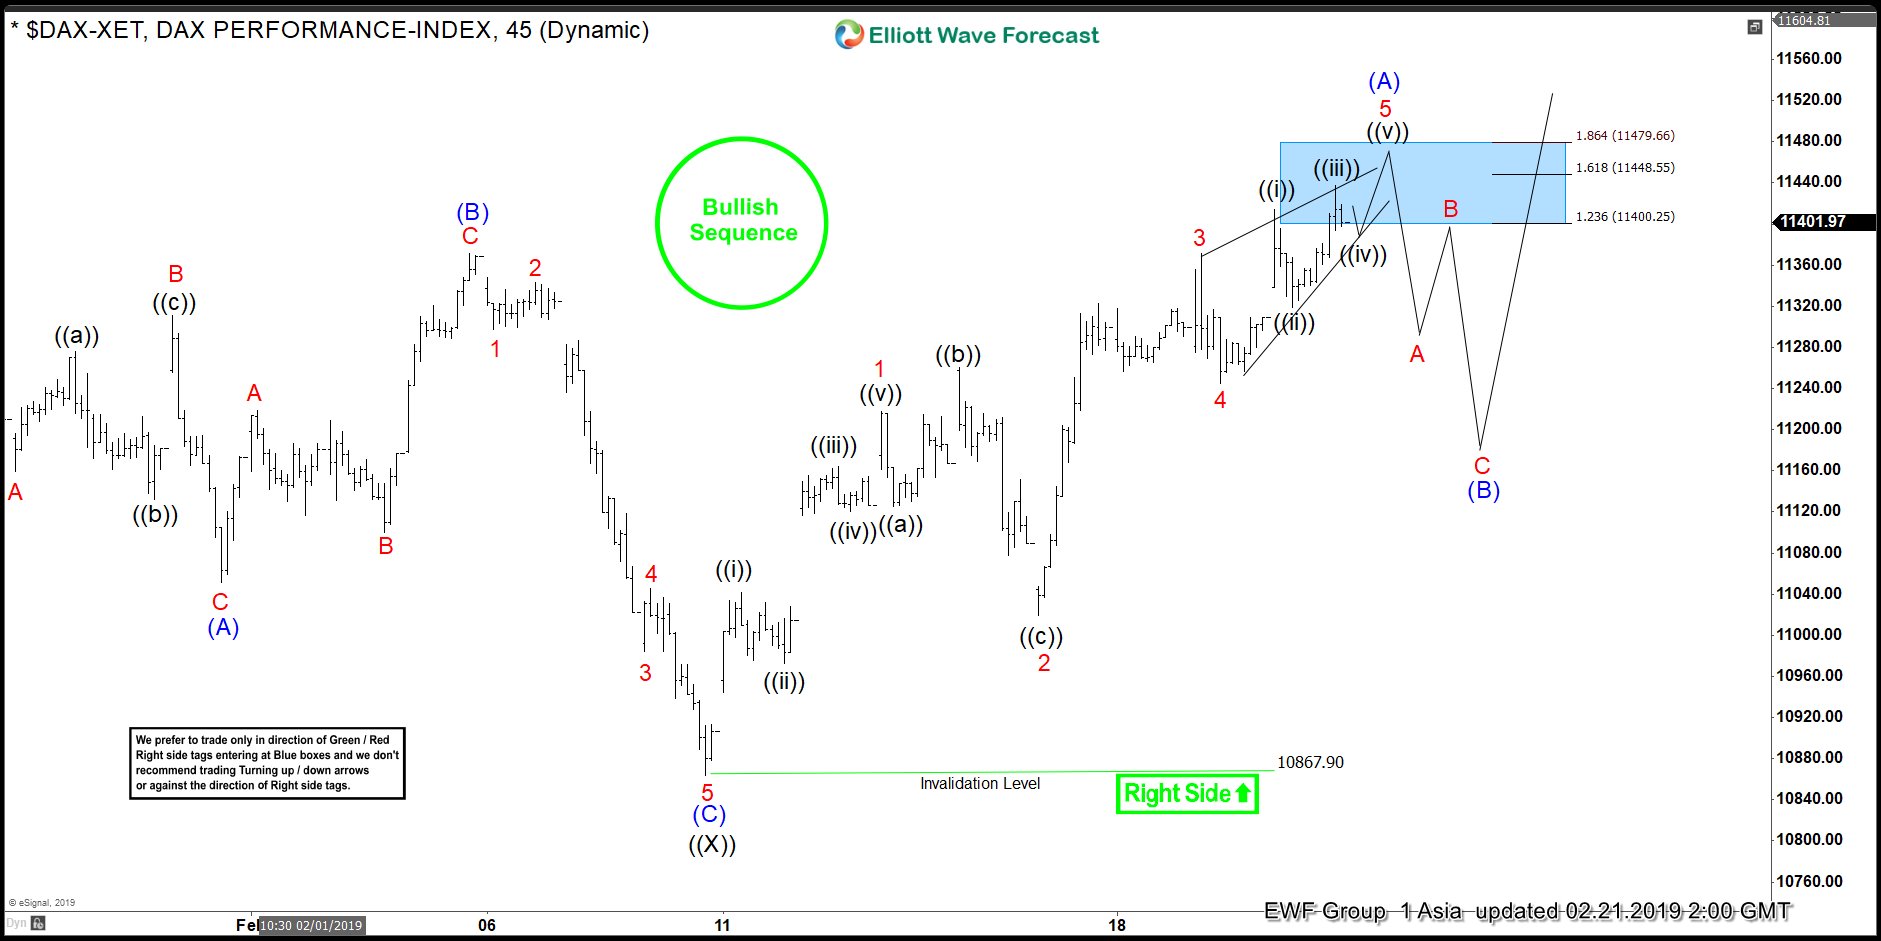
1 hour DAX Elliott Wave chart