The ETF is rallying from the blue box after forming the low on 12.26.2018, Blue box is an area where buyers and sellers agree in the next direction. We have developed a system in which we present the boxes to members on our charts and combine it with the right side to enter the market. The decline in $SPY from all-time high is in a classic ABC which is a set of 2 cycles. Each cycle has a subdivision of 5 waves and it’s commonly called zigzag Elliott Wave structure.
After ending the zigzag, the ETF has reacted higher in what looks like an impulse. The Elliott Wave Theory describes an Impulse as a sequence of 5-3-5-3-5. The Impulse main rules are :
- Wave 1, 3, and 5 subdivision are impulse. The subdivision in this case is ((i)), ((ii)), ((iii)), ((iv)), and ((v)) in minute degree.
- Wave 2 can’t retrace more than the beginning of wave 1
- The shortest wave of the three impulse waves, namely wave 1, 3, and 5, can not be wave 3
- Wave 4 does not overlap with the price territory of wave 1
- Wave 5 needs to end with momentum divergence
Looking at the following chart since the lows on 12.26.2019, most of the rules are in place. There is no overlap between wave (1) and (4), and we can also see extension in the move. We believe the Index is doing a wave ((3)) extension and it has a triple nest since the lows last year.
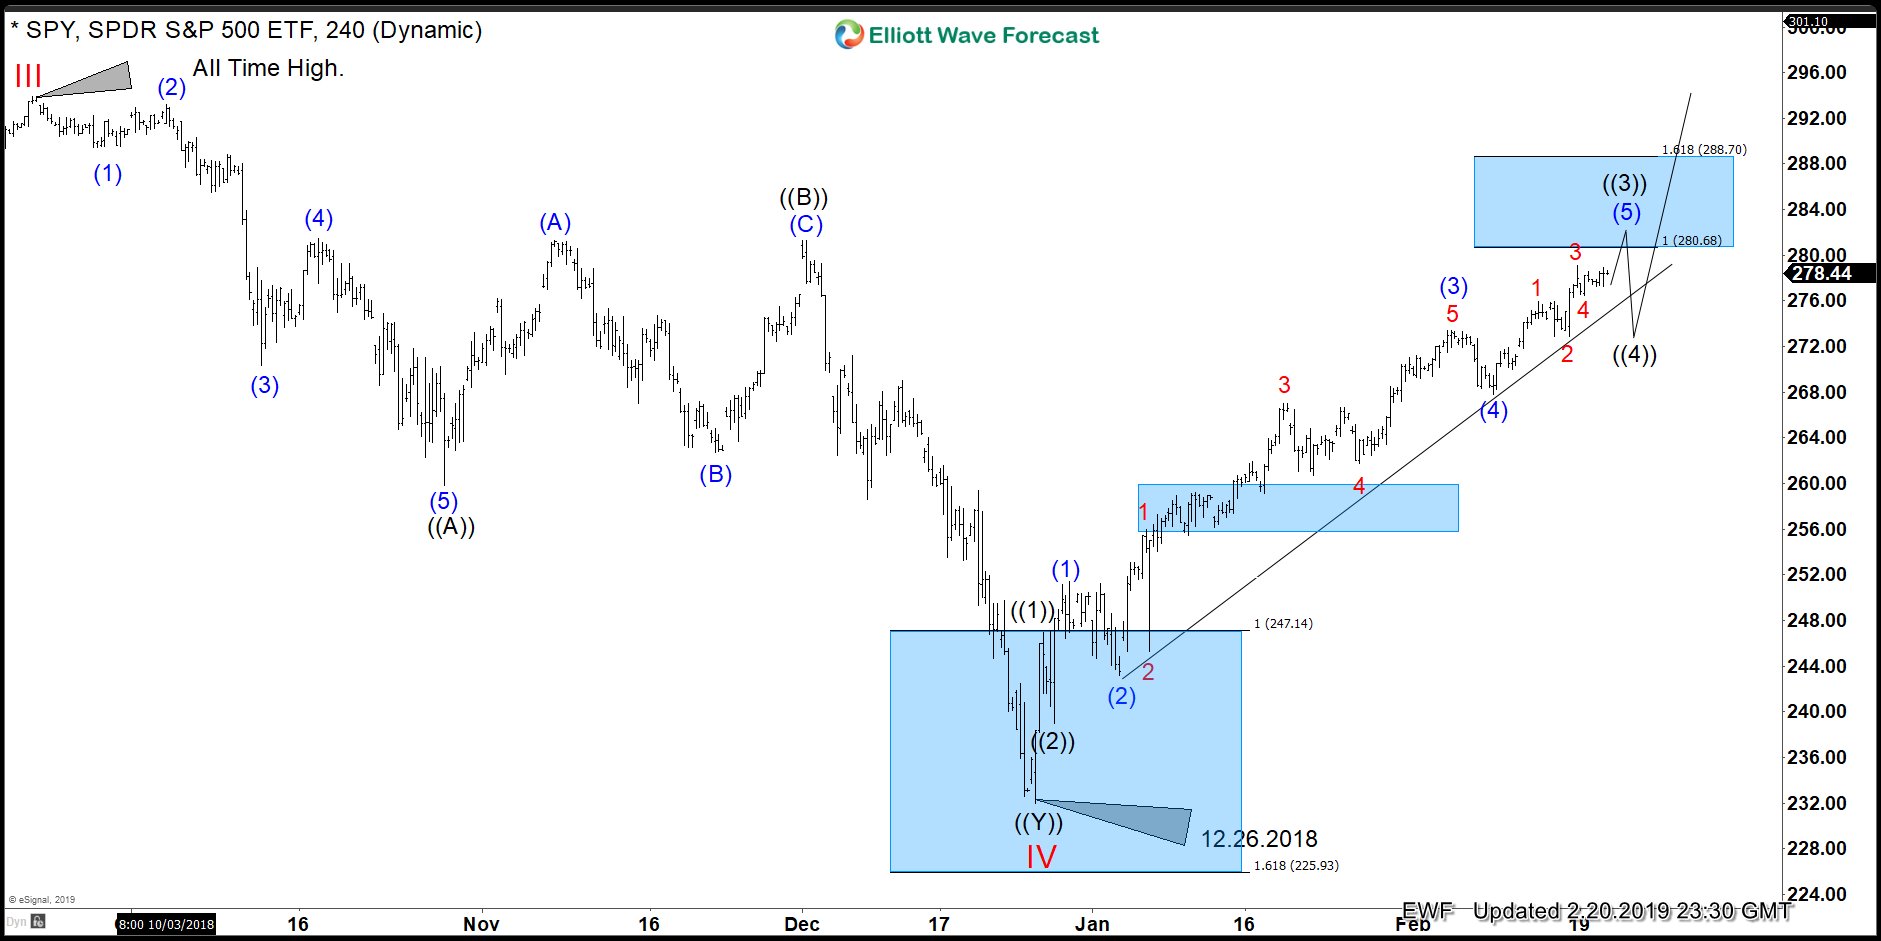
The Blue box at the top is the area we believe wave ((3)) will be ending. It is also where wave (5) is equal in length to wave (1) in Blue. The RSI (Relative Strength Index) is showing a momentum divergence and it is a signal that a reset needs to happen. We believe wave ((4)) pullback will be another buying opportunity because the correction in Indices like $DAX will need more upside.